Contents
- 1 ASSIGNMENT ONE
- 2 Answer the following Descriptive Category questions in about 500 words each. Each question carries 20 marks. Word limit does not apply in case of numerical questions. 2 × 20 = 40
- 3 1. (a.) Explain Circular flow in four sector model with the help of diagram.
- 4 (b) Explain Production possibility curve with the help of diagram.
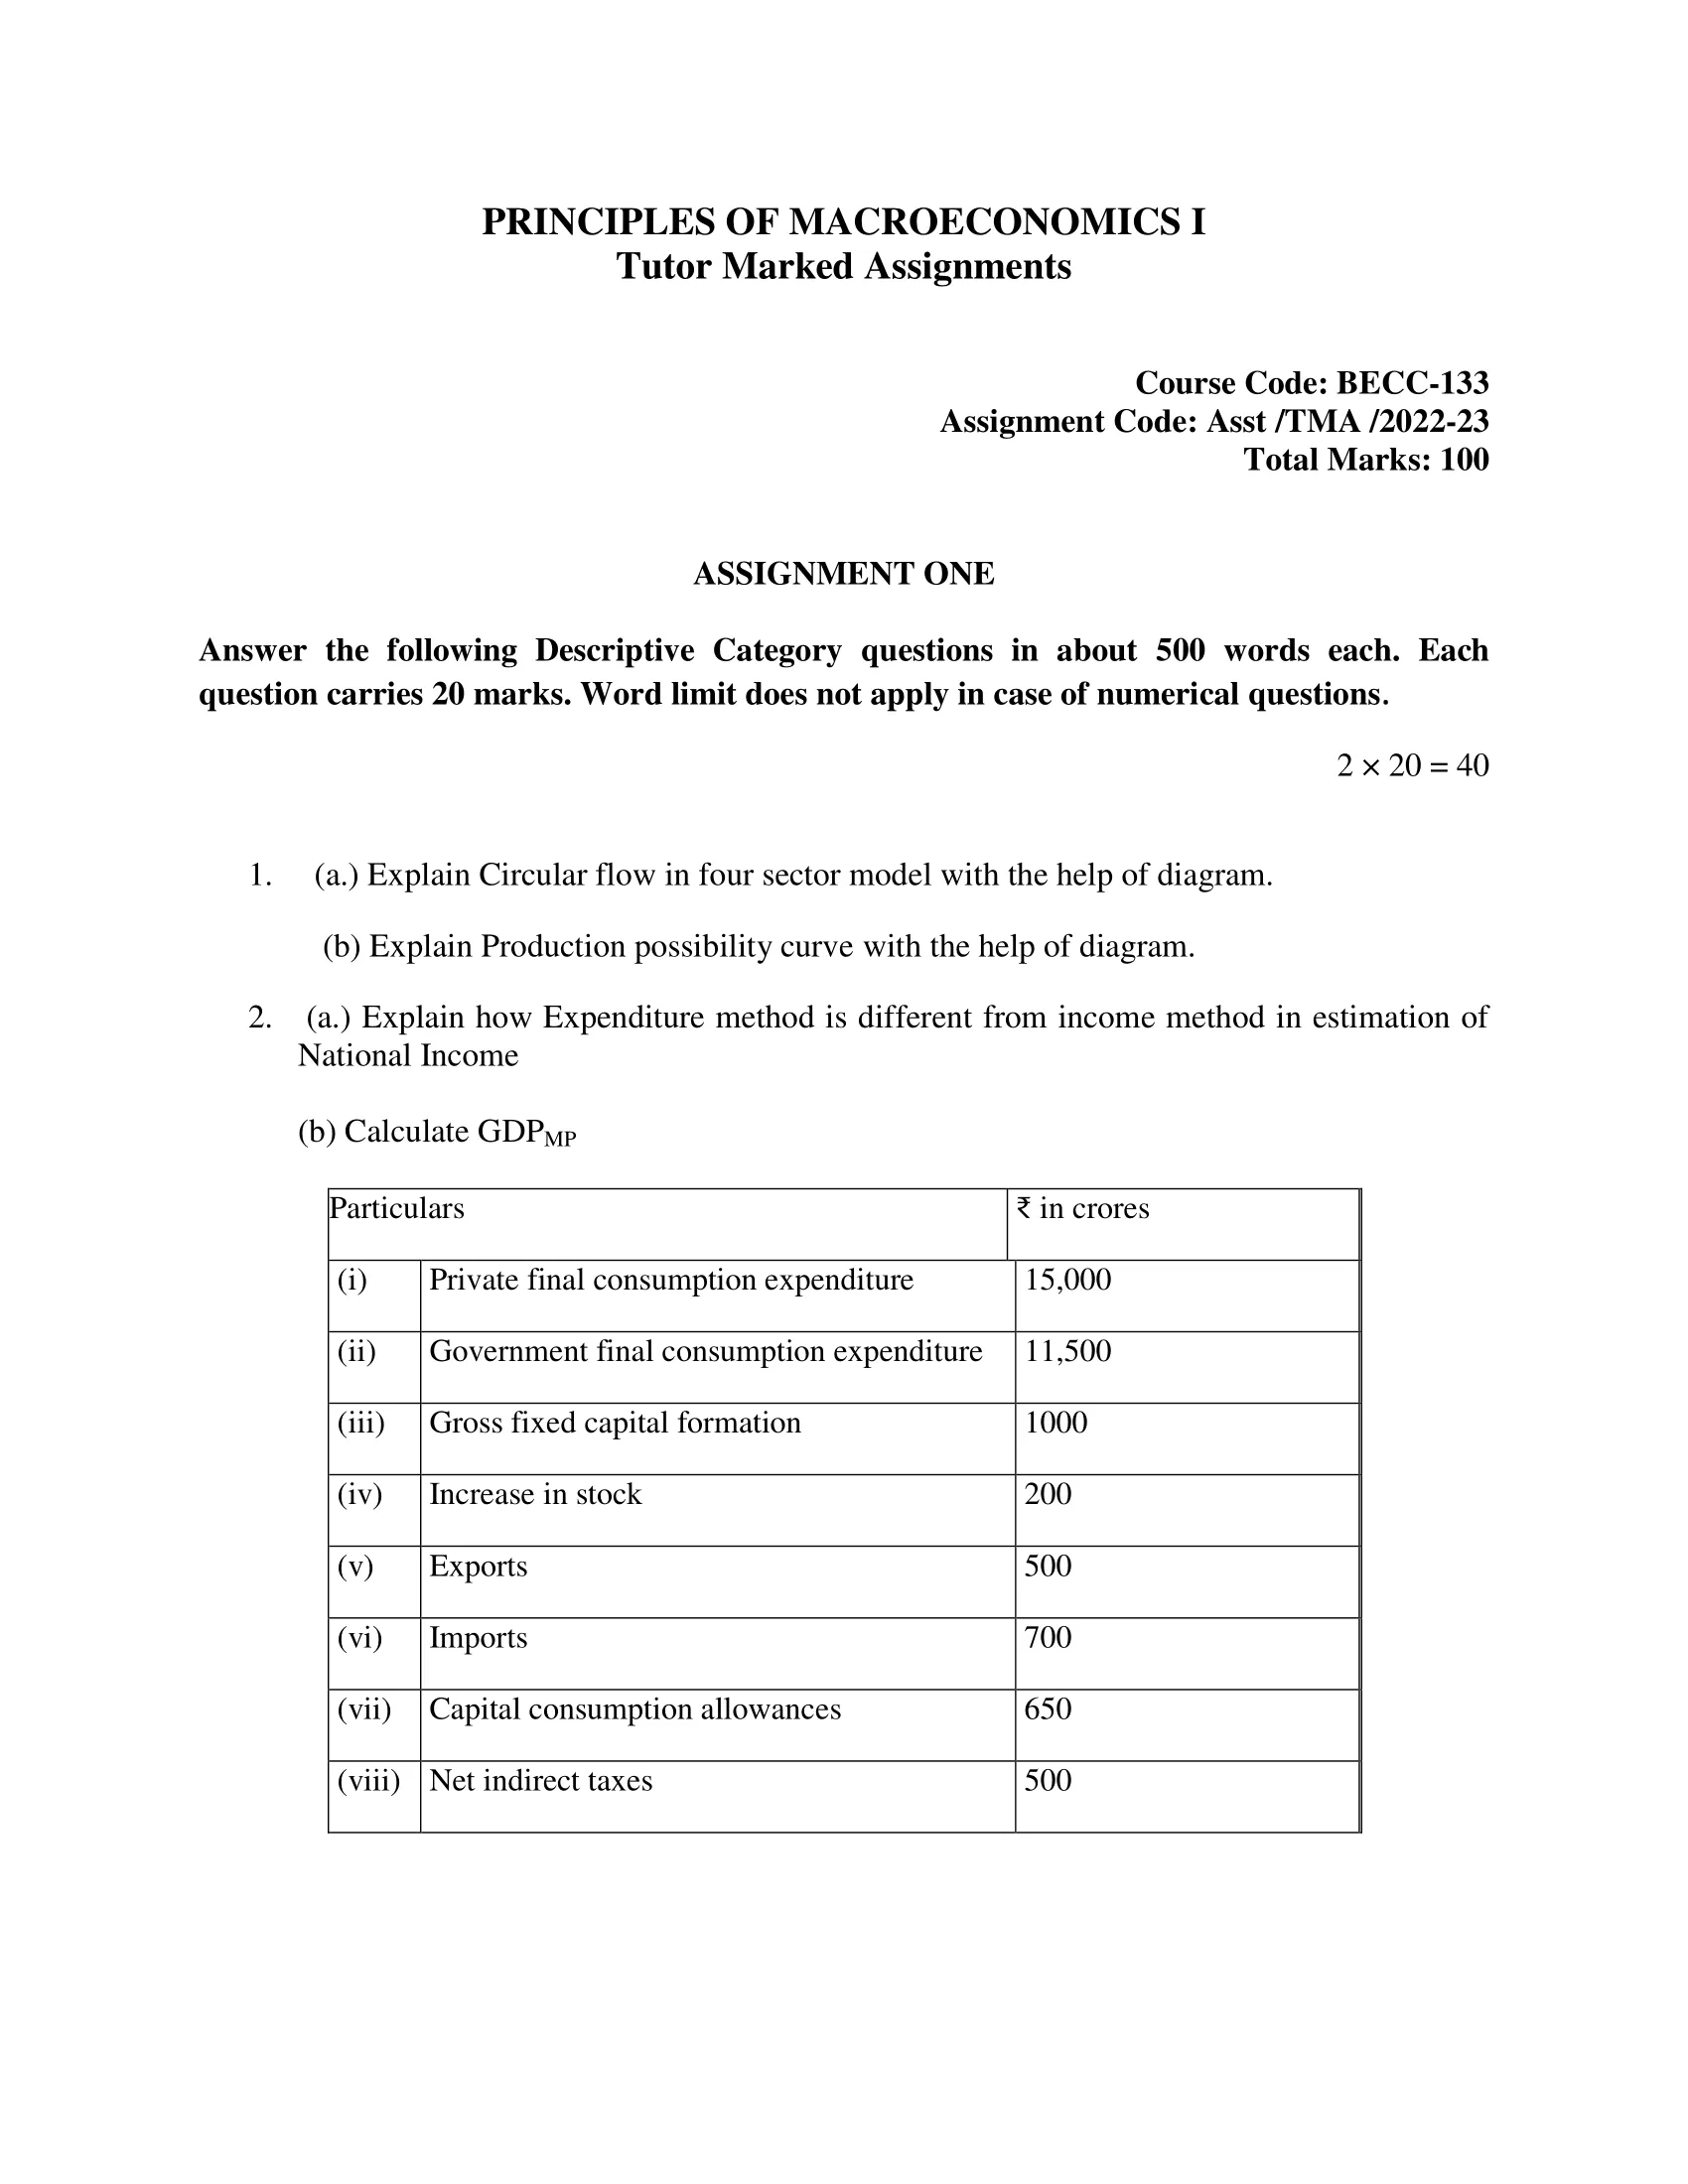
- 5 2. (a.) Explain how Expenditure method is different from income method in estimation of National Income.
- 6 (b) Calculate GDPMP Particulars ₹ in crores
- 7 ASSIGNMENT TWO
- 8 Answer the following Middle Category questions in about 250 words each. Each question carries 10 marks. Word limit does not apply in case of numerical questions. 3 X 10=30
- 9 3. Discuss the salient features of Classical theory. How is it different from Keynesian theory?
- 10 4. Explain the following:
- 11 a. Investment multiplier
- 12 b. Balance of Trade
- 13 c. Hot money
- 14 d. Gross Domestic Product and Gross National Product
- 15 5. a. Explain Keynesian theory of demand for money.
- 16 b. Derive liquidity preference curve.
- 17 ASSIGNMENT THREE
- 18 Answer the following Short Category questions in about 100 words each. Each question carries 6 marks.
- 19 6. Explain various tools of monetary policy.
- 20 7. The aggregate income increases from 40 lakh to 200 lakh, as a result of an increase in investment of 16 lakh. What will be the values of MPC and MPS?
- 21 8. What are the measures of Money supply in India?
- 22 9. Define the term ‘invisibles’ in the Balance of Payments account. Give two examples of invisibles.
- 23 10. How does the Balanced budget multiplier work?

| Title | IGNOU: BECC-133 Solved Assignment 2022-2023 (PRINCIPLES OF MACROECONOMICS I) |
| University | IGNOU |
| Degree | Bachelor Degree Programme |
| Course Code | BECC-133 |
| Course Name | PRINCIPLES OF MACROECONOMICS I |
| Programme Name | Bachelor of Arts (General) |
| Programme Code | BAG |
| Total Marks | 100 |
| Year | 2022-2023 |
| Language | English |
| Assignment Code | Asst /TMA /2022-23 |
| Last Date for Submission of Assignment: | For June Examination: 31st April For December Examination: 30th September |
ASSIGNMENT ONE
Answer the following Descriptive Category questions in about 500 words each. Each question carries 20 marks. Word limit does not apply in case of numerical questions. 2 × 20 = 40
1. (a.) Explain Circular flow in four sector model with the help of diagram.
Ans: The circular flow of income model is a basic framework used to describe the flow of goods, services, and money in an economy. It depicts the interdependence of the different sectors of an economy and how they interact with each other. The model consists of four main sectors: households, firms, government, and foreign sector.
The household sector is made up of individuals and families who earn income from wages, salaries, and other sources. They use their income to purchase goods and services from the firms sector, which provides the goods and services that the households demand.
The firms sector is made up of companies that produce and sell goods and services. They use the revenue from the sale of goods and services to pay for the factors of production, including labor and capital.
The government sector is responsible for providing public goods and services, such as infrastructure and national defense. The government collects taxes from households and firms to fund its spending on public goods and services.
The foreign sector represents the rest of the world and includes foreign firms and households that trade with the domestic economy. Exports from the domestic firms sector flow to the foreign sector in exchange for imports, which flow from the foreign sector to the domestic firms sector.
The circular flow of income in the four-sector model can be represented in a diagram, as shown below:
[Insert Diagram Here]
As the diagram shows, the flow of goods and services moves in one direction, while the flow of money moves in the opposite direction. Households provide the firms sector with factors of production in exchange for wages and salaries, while the firms sector provides the household sector with goods and services in exchange for money.
The government sector influences the circular flow of income through its role in providing public goods and services and collecting taxes. The foreign sector influences the circular flow of income through trade with the domestic economy.
(b) Explain Production possibility curve with the help of diagram.
Ans: The production possibility curve (PPC) is a graphical representation of the trade-off between two different goods that an economy can produce. It is used to show the maximum potential output of one good, given a certain level of production of the other good. The PPC is a fundamental concept in microeconomics, as it illustrates the idea of opportunity cost and the concept of efficient use of resources.
The PPC is constructed by plotting the maximum combination of two goods that can be produced, given a set of available resources and technology. The two goods are typically labeled on the x and y-axes, and the curve represents all the points where the maximum possible production of one good is achieved, given the production of the other good.
For example, consider an economy that can produce two goods: food and clothing. The economy has limited resources, and a choice must be made about how to allocate these resources between the production of food and clothing. The PPC shows the maximum combination of food and clothing that can be produced, given the available resources and technology.
The shape of the PPC depends on several factors, including the availability of resources, the state of technology, and the efficiency with which resources are used. In general, the PPC is bowed out from the origin, which indicates that increasing the production of one good requires sacrificing some production of the other good. This trade-off is known as opportunity cost.
The opportunity cost of producing one good is the opportunity cost of the other good that must be given up. As we move along the PPC, the opportunity cost of producing more of one good increases, as more and more resources must be allocated to its production. This results in a higher opportunity cost of producing the other good.
In addition to illustrating the trade-off between two goods, the PPC also shows the concept of efficient use of resources. Points along the PPC represent efficient combinations of two goods, as they represent the maximum production of one good given the production of the other good. Points inside the PPC, on the other hand, represent inefficient use of resources, as they indicate that the economy is not producing the maximum possible output of both goods. Points outside the PPC are impossible, as they indicate that the economy is producing more of one good than can be produced given the available resources and technology.
The PPC can also be used to illustrate the effects of technological progress and changes in resource availability on the economy. For example, an improvement in technology may shift the PPC outwards, as the economy is able to produce more of both goods with the same resources. An increase in resource availability may have a similar effect, allowing the economy to produce more of both goods.
2. (a.) Explain how Expenditure method is different from income method in estimation of National Income.
Ans:
(b) Calculate GDPMP Particulars ₹ in crores
| S.No. | Particulars | Rs. In Crores |
|---|---|---|
| (i) | Private final consumption expenditure | 15,000 |
| (ii) | Government final consumption expenditure | 11,500 |
| (iii) | Gross fixed capital formation | 1000 |
| (iv) | Increase in stock | 200 |
| (v) | Exports | 500 |
| (vi) | Imports | 700 |
| (vii) | Capital consumption allowances | 650 |
| (viii) | Net indirect taxes | 500 |
Ans. Gross Domestic Product at Market Prices (GDPMP) can be calculated by using the following formula:
GDPMP = Private final consumption expenditure + Government final consumption expenditure + Gross fixed capital formation + Increase in stock + Exports – Imports + Net indirect taxes – Capital consumption allowances
Using the data provided in the question:
GDPMP = 15,000 + 11,500 + 1,000 + 200 + 500 – 700 + 500 – 650 = 26,550 crores
Therefore, the Gross Domestic Product at Market Prices is 26,550 crores.
ASSIGNMENT TWO
Answer the following Middle Category questions in about 250 words each. Each question carries 10 marks. Word limit does not apply in case of numerical questions. 3 X 10=30
3. Discuss the salient features of Classical theory. How is it different from Keynesian theory?
Ans: Classical theory is a cornerstone of classical economics, which emerged in the late 18th and early 19th centuries. The central idea of this theory is that the economy is self-regulating and operates at full employment without the need for government intervention. Some of the key features of classical theory are:
- Laissez-faire: The theory supports a minimal role for government in the economy, allowing market forces to determine prices, wages, and production.
- Say’s Law: The theory states that supply creates its own demand, meaning that as businesses produce goods and services, they generate an equivalent amount of income for consumers to purchase these goods.
- Flexible Prices and Wages: The theory states that prices and wages are flexible and can adjust quickly to changes in supply and demand, helping to restore full employment.
- Full Employment: The theory assumes that the economy will naturally reach full employment, meaning that everyone who wants to work will have a job.
In contrast, Keynesian theory, which was developed by John Maynard Keynes in the 1930s, recognizes that the economy is not always self-regulating and can experience periods of high unemployment. Keynesian economics emphasizes the role of government intervention, through policies such as fiscal and monetary stimulus, to stabilize the economy and promote full employment.
4. Explain the following:
a. Investment multiplier
Ans: The investment multiplier is a concept in macroeconomics that measures the impact of an increase in investment spending on the overall level of economic activity. The basic idea is that an increase in investment spending leads to a larger increase in total output (GDP) due to the ripple effect it creates throughout the economy.
The investment multiplier works through the process of the circular flow of income. An increase in investment spending leads to an increase in demand for goods and services, which in turn leads to an increase in employment and income for workers. These workers then have more income to spend, leading to further increases in demand for goods and services, and so on. This chain reaction of increased spending and income is referred to as the multiplier effect.
The size of the multiplier depends on several factors, including the marginal propensity to consume (the percentage of additional income that is spent rather than saved), the marginal propensity to import (the percentage of additional income that is spent on foreign goods), and the marginal propensity to invest (the percentage of additional income that is invested rather than consumed or imported). The larger the marginal propensity to consume, the larger the multiplier will be.
In practice, the investment multiplier is not always as large as predicted by theory due to various market imperfections and government policies. For example, an increase in investment spending may lead to higher interest rates, which can reduce the impact of the multiplier.
b. Balance of Trade
Ans: The balance of trade, also known as the trade balance, is the difference between a country’s exports and imports. If a country exports more goods and services than it imports, it has a positive trade balance, or a trade surplus. Conversely, if a country imports more than it exports, it has a negative trade balance, or a trade deficit.
The balance of trade is an important indicator of a country’s economic health, as it reflects the demand for a country’s goods and services in the international market. A trade surplus indicates that the country is competitive in the global market and that its economy is strong, while a trade deficit suggests that the country is importing more goods and services than it is exporting, potentially putting a strain on its economy.
There are several factors that can influence a country’s trade balance, such as exchange rates, the cost of labor, and the availability of raw materials. For example, a weak currency can make a country’s exports more competitive, while high labor costs can make it more difficult to compete in the international market. Additionally, the availability of raw materials and resources can also impact the trade balance, as countries that are rich in natural resources may be able to export these resources, while countries that must import these resources may face a trade deficit.
c. Hot money
Ans: Hot money refers to short-term, speculative capital flows that are quickly moved in and out of a country’s economy in response to changes in interest rates or expectations of exchange rate movements. This type of investment is typically highly mobile and seeks to take advantage of short-term profit opportunities, often at the expense of long-term economic stability.
Hot money can have both positive and negative impacts on an economy. On the one hand, hot money inflows can increase the supply of investment capital, leading to economic growth and development. On the other hand, hot money can also cause rapid swings in exchange rates and lead to currency appreciation, making a country’s exports more expensive and less competitive in the international market. Additionally, hot money flows can cause interest rates to fluctuate rapidly, making it more difficult for businesses and consumers to plan for the future.
In order to attract hot money, many countries offer favorable interest rates or have relaxed regulations on capital flows. However, this type of investment can also be unpredictable and volatile, making it difficult for countries to plan for the long-term. To mitigate the negative impacts of hot money, some countries have implemented measures such as capital controls or taxes on short-term capital flows.
d. Gross Domestic Product and Gross National Product
Ans: Gross Domestic Product (GDP) and Gross National Product (GNP) are two of the most commonly used measures of a country’s economic output. They are used to assess the size and strength of an economy and are widely used by economists, policymakers, and investors to make economic decisions.
GDP is defined as the total value of goods and services produced within a country’s borders in a given time period, typically a year. This measure includes all goods and services produced by both foreign and domestic entities operating within the country. GDP is widely considered to be the most comprehensive measure of a country’s economic output and is often used as a benchmark to compare the economic performance of different countries.
GNP, on the other hand, measures the total income of a country’s residents, regardless of where they are located. This measure includes the income generated by domestic residents abroad and the income generated by foreign residents within the country’s borders. GNP is considered a better measure of a country’s economic welfare as it takes into account the income earned by its citizens, even if they are not physically located in the country.
Both GDP and GNP are useful measures of economic output, but they have different applications and provide different information. GDP is primarily used to measure a country’s economic output, while GNP is used to measure a country’s economic welfare. Additionally, differences in the calculation of GDP and GNP can lead to different conclusions about a country’s economic performance.
5. a. Explain Keynesian theory of demand for money.
Ans: Keynesian theory of demand for money, also known as the liquidity preference theory, is a key component of the broader Keynesian macroeconomic framework. This theory posits that the demand for money is determined by three factors: the transaction motive, the precautionary motive, and the speculative motive.
The transaction motive refers to the demand for money to facilitate everyday transactions, such as buying goods and services. This demand is driven by the level of income and the frequency of transactions. The higher the income and the more frequent the transactions, the greater the demand for money to facilitate these transactions.
The precautionary motive refers to the demand for money as a form of insurance against uncertain future events. This motive is driven by the need to have a buffer of liquid assets in case of unexpected events, such as job loss or illness. The greater the perceived uncertainty, the greater the demand for money to serve as a precautionary buffer.
The speculative motive refers to the demand for money as an investment vehicle. This motive is driven by the expectation of changes in the value of money, such as changes in interest rates or exchange rates. The greater the expected changes in the value of money, the greater the demand for money for speculative purposes.
b. Derive liquidity preference curve.
Ans: The liquidity preference curve is a graphical representation of the relationship between the interest rate and the demand for money. The curve shows how changes in the interest rate affect the quantity of money demanded for the three motives of money demand described in Keynesian theory: the transaction motive, the precautionary motive, and the speculative motive.
Starting with the transaction motive, as the interest rate increases, the opportunity cost of holding money instead of earning interest on investments rises, leading to a decrease in the demand for money for transactions. This results in a downward-sloping transaction motive portion of the liquidity preference curve.
Next, with the precautionary motive, as the interest rate increases, the perceived uncertainty of the future decreases, leading to a decrease in the demand for money as a precautionary buffer. This results in a flatter portion of the liquidity preference curve.
Finally, with the speculative motive, as the interest rate increases, the expected future return on investment decreases, leading to a decrease in the demand for money for speculative purposes. This results in a downward-sloping speculative motive portion of the liquidity preference curve.
The overall liquidity preference curve is a combination of these three portions and shows the relationship between the interest rate and the total demand for money. The shape of the curve is influenced by the relative importance of each motive and can change as economic conditions change.
ASSIGNMENT THREE
Answer the following Short Category questions in about 100 words each. Each question carries 6 marks.
6. Explain various tools of monetary policy.
Ans: Monetary policy refers to the measures taken by a central bank to regulate the supply and demand of money in an economy. The primary objective of monetary policy is to achieve stability in the general price level, full employment, and economic growth. The various tools of monetary policy include:
- Open market operations: This refers to the central bank’s purchase or sale of government securities in the open market to influence the supply of money.
- Reserve requirement: This refers to the percentage of deposits that banks must keep with the central bank, which affects the amount of money available for lending.
- Discount rate: This refers to the interest rate at which banks can borrow money from the central bank.
- Repurchase agreements: This refers to a method of borrowing or lending money through the sale and subsequent repurchase of securities.
- Margin requirements: This refers to the amount of money that investors must deposit as collateral when borrowing money to purchase securities.
These tools of monetary policy are used by central banks to control the money supply, interest rates, and inflation in an economy. By adjusting the availability of money, central banks can influence economic activity and achieve their policy objectives.
7. The aggregate income increases from 40 lakh to 200 lakh, as a result of an increase in investment of 16 lakh. What will be the values of MPC and MPS?
Ans: When the aggregate income increases from 40 lakh to 200 lakh, as a result of an increase in investment of 16 lakh, the values of MPC (Marginal Propensity to Consume) and MPS (Marginal Propensity to Save) can be calculated as follows:
MPC = ΔC / ΔY = ΔC / (ΔI + ΔC)
where ΔC is the change in consumption, ΔY is the change in aggregate income, and ΔI is the change in investment.
Since ΔI = 16 lakh and ΔY = 200 lakh – 40 lakh = 160 lakh, we can calculate ΔC as follows:
ΔC = ΔY – ΔI = 160 lakh – 16 lakh = 144 lakh
So, MPC = ΔC / ΔY = 144 lakh / 160 lakh = 0.9
MPS = ΔS / ΔY = ΔS / (ΔI + ΔS)
where ΔS is the change in saving.
So, ΔS = ΔI – ΔC = 16 lakh – 144 lakh = -128 lakh
And, MPS = ΔS / ΔY = -128 lakh / 160 lakh = -0.8
Therefore, the values of MPC and MPS are 0.9 and -0.8, respectively.
8. What are the measures of Money supply in India?
Ans: In India, money supply is measured through various aggregates, commonly referred to as “Money Supply Measures”. The measures of money supply in India are:
- M1: It consists of currency in circulation, demand deposits with banks, and other deposits with the Reserve Bank of India.
- M2: It includes M1 plus time deposits with banks.
- M3: It includes M2 plus large time deposits, and institutional deposits with banks.
- M4: It includes M3 plus deposits with post office savings banks.
These measures of money supply help in tracking the growth and circulation of money in an economy and are an important tool for the central bank in formulating monetary policy. The Reserve Bank of India, the central bank of India, regularly releases data on these aggregates to provide insight into the state of the economy and the money supply.
9. Define the term ‘invisibles’ in the Balance of Payments account. Give two examples of invisibles.
Ans: “Invisibles” is a term used in the Balance of Payments (BoP) account to refer to transactions in services and intangible goods that do not involve the physical exchange of goods. Invisibles are transactions that are not recorded in the visible trade balance, which only accounts for goods that are physically traded across national borders.
Two examples of invisibles are:
- Services: This includes transactions in services such as tourism, consulting, and financial services. For example, if a foreign tourist visits a country and spends money on services such as accommodation, transportation, and entertainment, this would be recorded as a credit in the invisibles balance in the country’s BoP account.
- Intellectual property: This includes transactions in intangible goods such as patents, trademarks, and copyrights. For example, if a company in one country licenses its technology to a company in another country, this would be recorded as a credit in the invisibles balance in the BoP account of the country where the technology was licensed.
10. How does the Balanced budget multiplier work?
Ans: The balanced budget multiplier is a macroeconomic concept that illustrates the impact of changes in government spending and taxation on the overall economy. The balanced budget multiplier assumes that any increase in government spending is matched by an equal increase in taxation. This means that the government’s budget remains balanced, with spending and revenue equal, after the change in spending and taxation.
The balanced budget multiplier is calculated as the reciprocal of 1 minus the marginal propensity to consume (MPC), where MPC is the fraction of an increase in income that is spent on consumption. A larger MPC means a larger balanced budget multiplier, as a larger fraction of the increased income is spent, leading to a larger overall impact on the economy.
The balanced budget multiplier can be used to estimate the impact of changes in government spending and taxation on aggregate demand and the economy as a whole. If the government increases spending, the balanced budget multiplier will show the impact of this increase on the overall level of income and output in the economy.
How to Download BECC-133 Solved Assignment?
You can download it from the www.edukar.in, they have a big database for all the IGNOU solved assignments.
Is the BECC-133 Solved Assignment Free?
Yes this is absolutely free to download the solved assignment from www.edukar.in
What is the last submission date for BECC-133 Assignment?
For June Examination: 31st April, For December Examination: 30th October
")
")

")


")


")


 Solved Assignment 2022-2023")