Contents
- 1 Assignment One
- 2 Answer the following Descriptive Category questions in about 500 words each. Each question carries 20 marks. Word limit does not apply in case of numerical questions. 2 × 20=40
- 3 1. Using appropriate diagrams discuss the rationale behind rationing system for allocation of scarce resources? What are the consequences associated with the rationing system?
- 4 2. (a) Consider a consumer earning income M and facing a choice between two commodities X and Y available at price PX and PY, respectively. Using appropriate diagrams with plotting good X and Y on the horizontal and vertical axis, respectively, bifurcate the price effect into substitution and income effect in case the price of good Y increases from PY to PY’ and the fact that both the commodities are normal goods.
- 5 (b) Consider a consumer who has to choose between two normal goods A and B. Initially his income is Rs 10, and the per unit price of good A and good B is Rs 2 and Rs 3, respectively. Now, assume income of the consumer increases to Rs 20, the price of good A rises to Rs 3 and that of good B rises to Rs 4.50. What will be the impact of this change on the demand of the two goods?
- 6 Assignment Two
- 7 Answer the following Middle Category questions in about 250 words each. Each question carries 10 marks. Word limit does not apply in case of numerical questions. 3 × 10 = 30
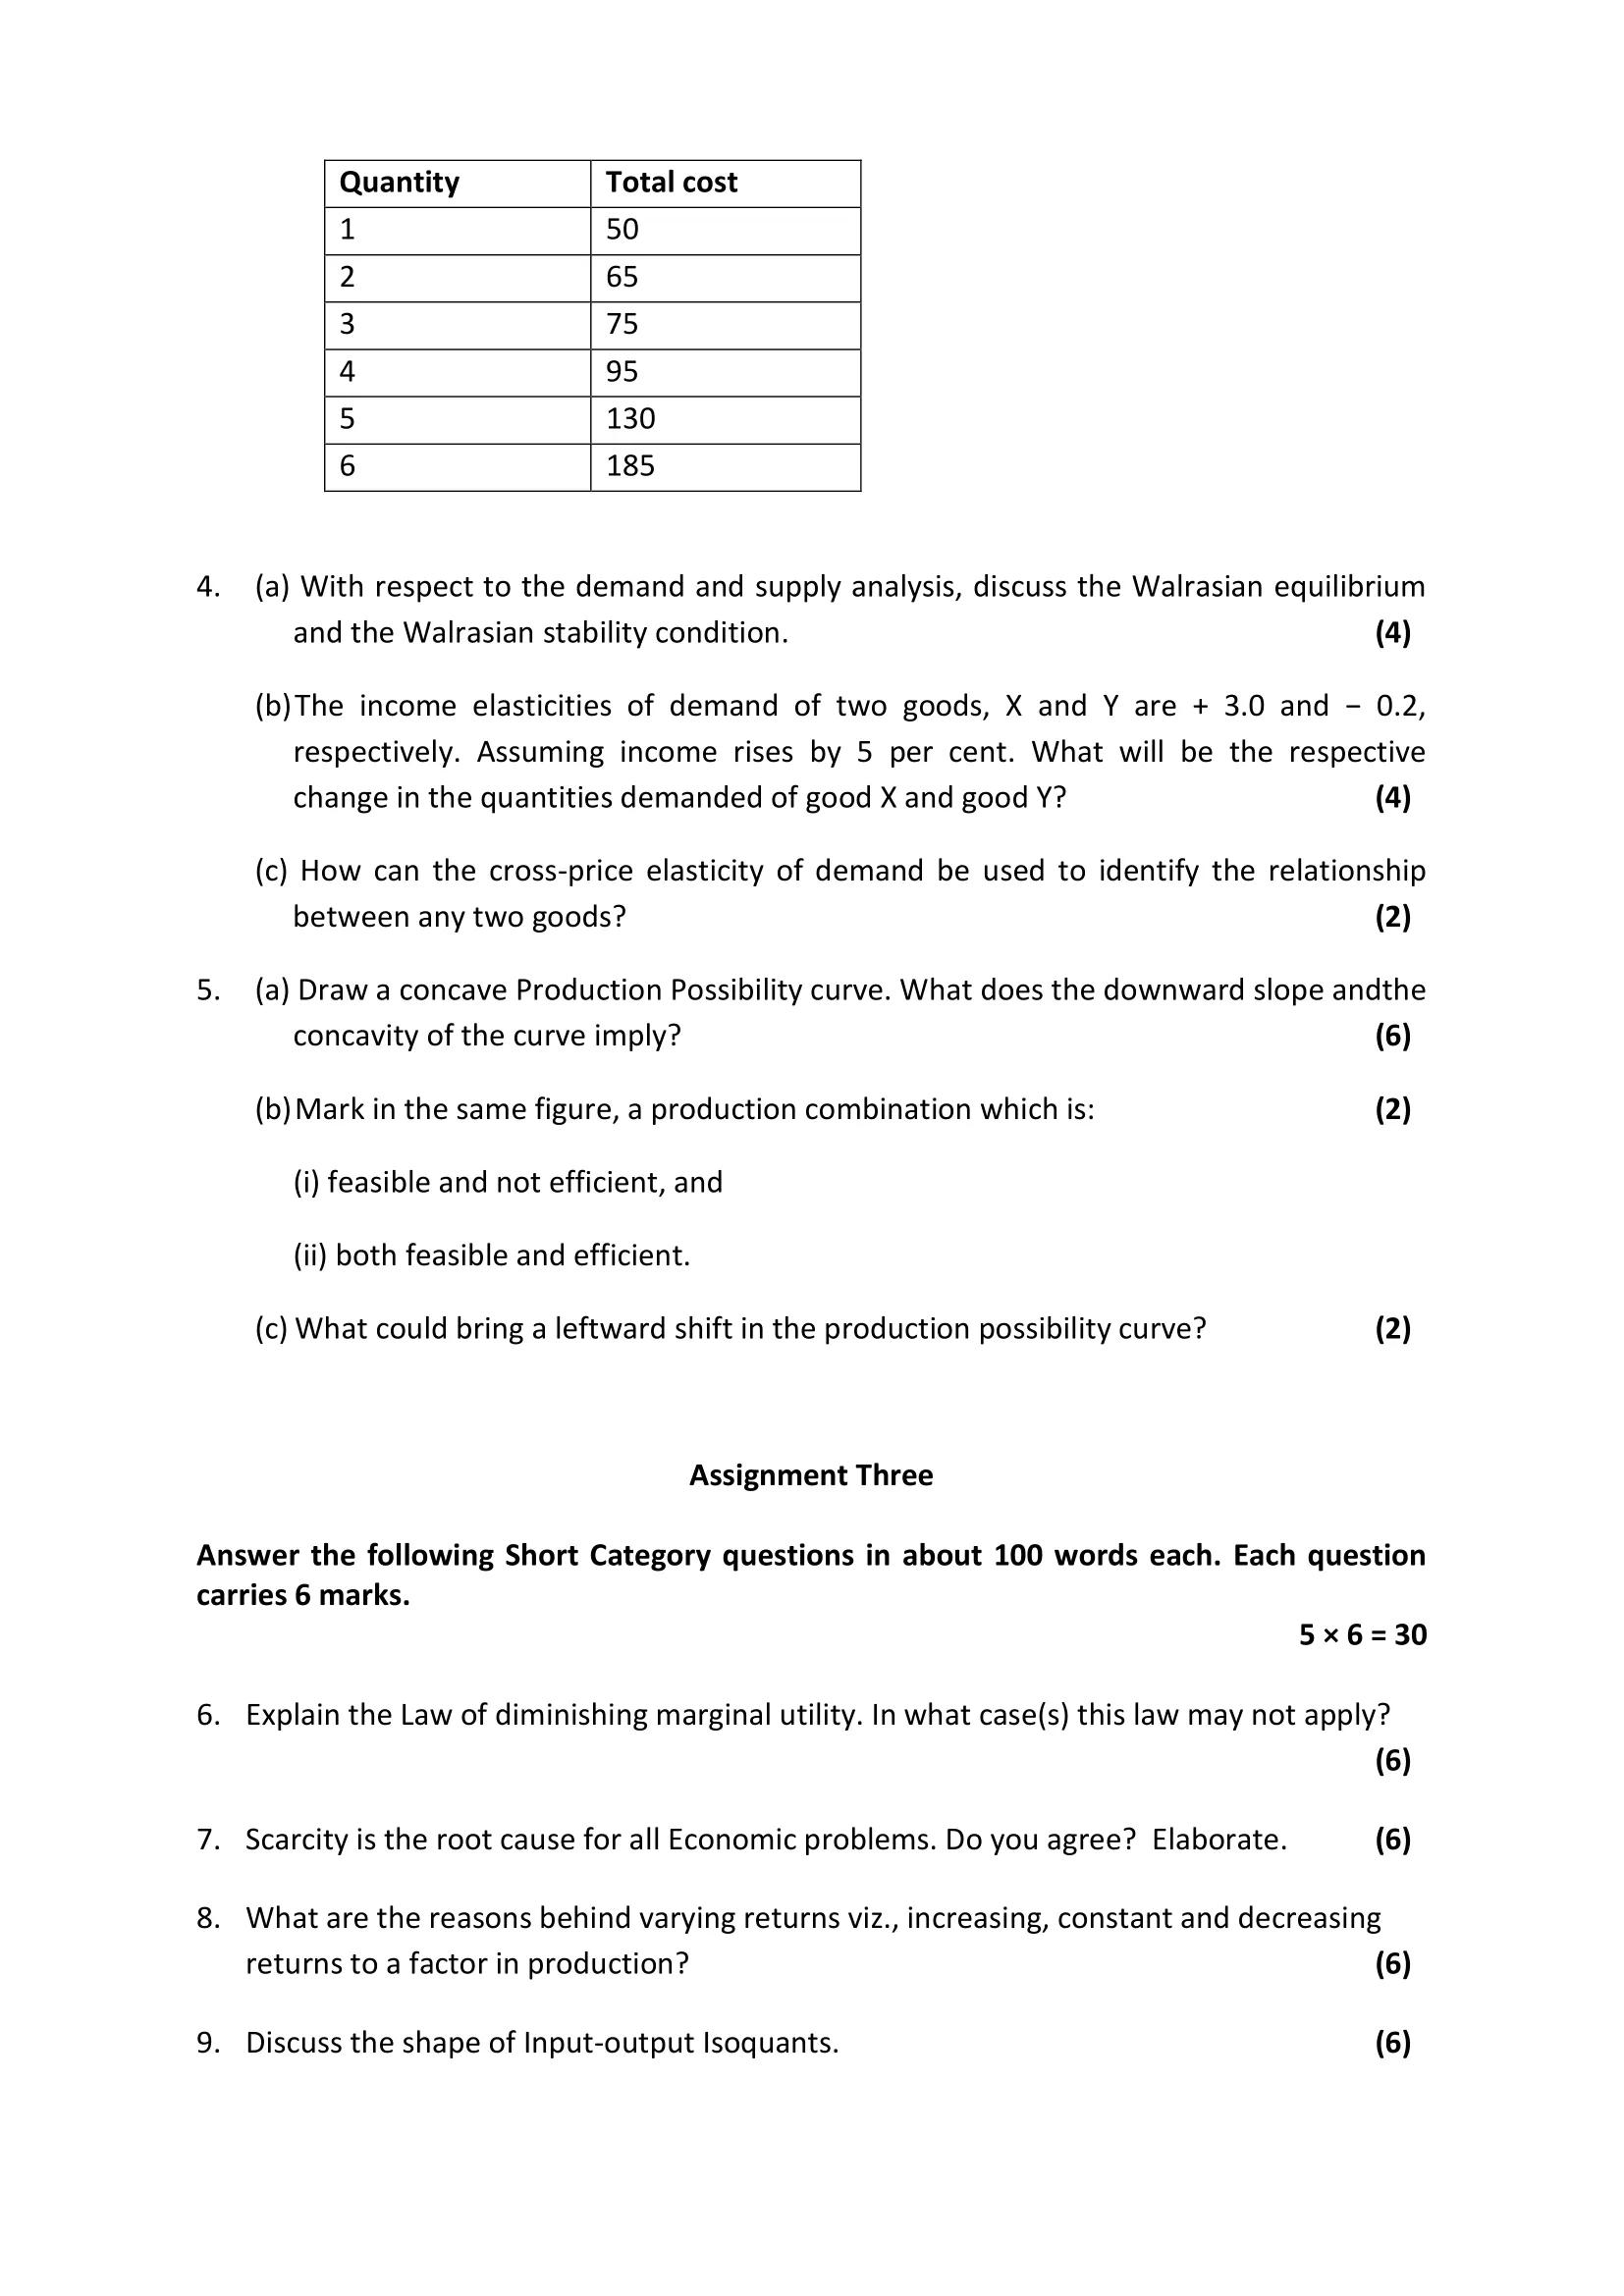
- 8 3. (a) Given that a firm experiences a linear homogenous production function, comment upon the shape of the Expansion path, both in the long run and in the short run.
- 9 4. a) With respect to the demand and supply analysis, discuss the Walrasian equilibrium and the Walrasian stability condition.
- 10 (b)The income elasticities of demand of two goods, X and Y are + 3.0 and − 0.2, respectively. Assuming income rises by 5 per cent. What will be the respective change in the quantities demanded of good X and good Y?
- 11 (c) How can the cross-price elasticity of demand be used to identify the relationship between any two goods?
- 12 5. (a) Draw a concave Production Possibility curve. What does the downward slope andthe concavity of the curve imply?
- 13 (b)Mark in the same figure, a production combination which is:(i) feasible and not efficient.
- 14 (ii) both feasible and efficient.
- 15 (c) What could bring a leftward shift in the production possibility curve?
- 16 Assignment Three
- 17 Answer the following Short Category questions in about 100 words each. Each question carries 6 marks. 5 × 6 = 30
- 18 6. Explain the Law of diminishing marginal utility. In what case(s) this law may not apply?
- 19 7. Scarcity is the root cause for all Economic problems. Do you agree? Elaborate.
- 20 8. What are the reasons behind varying returns viz., increasing, constant and decreasing returns to a factor in production?
- 21 9. Discuss the shape of Input-output Isoquants.
- 22 Differentiate between(i) Internal Economies and Internal Diseconomies of Scale.
- 23 (ii) Public good and Merit good

| Title | IGNOU: BECC-131 Solved Assignment 2022-2023 (PRINCIPLES OF MICROECONOMICS – I) |
| University | IGNOU |
| Degree | Bachelor Degree Programme |
| Course Code | BECC-131 |
| Course Name | PRINCIPLES OF MICROECONOMICS – I |
| Programme Name | Bachelor of Arts (General) |
| Programme Code | BAG |
| Total Marks | 100 |
| Year | 2022-2023 |
| Language | English |
| Assignment Code | Asst /TMA /2022-23 |
| Last Date for Submission of Assignment: | For June Examination: 31st March For December Examination: 30th September |
Assignment One
Answer the following Descriptive Category questions in about 500 words each. Each question carries 20 marks. Word limit does not apply in case of numerical questions. 2 × 20=40
1. Using appropriate diagrams discuss the rationale behind rationing system for allocation of scarce resources? What are the consequences associated with the rationing system?
Ans: Rationing is a system of allocating scarce resources to different individuals or groups based on certain criteria such as need, priority, or fairness. The rationale behind rationing systems is to ensure that the available resources are distributed in an equitable and efficient manner, so that everyone has access to the necessary goods and services. The use of appropriate diagrams is an effective way to illustrate and clarify the principles and outcomes of rationing systems.
Diagram 1: Scarcity and Allocation of Resources
This diagram depicts the basic economic problem of scarcity, where limited resources are used to meet unlimited wants and needs. The allocation of resources is the process of deciding how scarce resources should be used to satisfy different demands. Rationing is one way of allocating resources, as it limits the amount of a particular good or service that an individual can consume.
Diagram 2: Criteria for Rationing
The criteria for rationing vary depending on the specific situation, but they typically involve factors such as need, priority, or fairness. In emergency situations, such as natural disasters or public health crises, rationing may be based on need, with the most essential goods and services going to those who are most in need. In other cases, such as the allocation of limited medical resources, the criteria may be based on priority, with priority going to those who are most likely to benefit from treatment.
Diagram 3: Consequences of Rationing
The consequences of rationing can be both positive and negative. On the positive side, rationing can help ensure that scarce resources are distributed equitably and efficiently, reducing the waste and inefficiencies that can result from a free market approach. On the negative side, rationing can lead to increased waiting times and reduced access to goods and services for some individuals, especially those with lower priority or less need.
2. (a) Consider a consumer earning income M and facing a choice between two commodities X and Y available at price PX and PY, respectively. Using appropriate diagrams with plotting good X and Y on the horizontal and vertical axis, respectively, bifurcate the price effect into substitution and income effect in case the price of good Y increases from PY to PY’ and the fact that both the commodities are normal goods.
Ans: The consumer’s choice between two commodities, X and Y, is influenced by their respective prices, PX and PY. When the price of good Y increases from PY to PY’, the consumer’s budget constraint changes and affects their consumption of both goods X and Y. In this situation, it is helpful to bifurcate the price effect into the substitution effect and the income effect.
Diagram 1: Budget Constraint before Price Change
Initially, the consumer has an income of M and faces a choice between two commodities X and Y. The budget constraint shows the combinations of X and Y that the consumer can afford, given their income and the prices of the two goods. The budget constraint is represented by a straight line, where X is plotted on the horizontal axis and Y is plotted on the vertical axis.
Diagram 2: Price Effect after Price Change
After the price of good Y increases from PY to PY’, the budget constraint shifts inward and to the left, reflecting the fact that the consumer now has less purchasing power. The change in price has two effects on the consumer’s consumption: the substitution effect and the income effect.
The substitution effect refers to the effect of the price change on the consumer’s consumption of X and Y, without considering the change in their real income. The substitution effect is illustrated by the movement along the budget constraint from point A to point B. As the price of Y increases, the consumer substitutes Y with X, as X becomes relatively cheaper.
The income effect refers to the effect of the price change on the consumer’s consumption of X and Y, after considering the change in their real income. The income effect is illustrated by the movement from point B to point C. As the price of Y increases, the consumer’s real income decreases, and they consume less of both X and Y.
Diagram 3: Final Consumption
The final consumption of X and Y is represented by point C, which lies on the new budget constraint. The final consumption of X and Y reflects both the substitution effect and the income effect of the price change.
It is important to note that both goods X and Y are normal goods, meaning that as their prices change, the consumer’s consumption of them changes as well. If both goods were inferior goods, their consumption would increase as their prices increased.
(b) Consider a consumer who has to choose between two normal goods A and B. Initially his income is Rs 10, and the per unit price of good A and good B is Rs 2 and Rs 3, respectively. Now, assume income of the consumer increases to Rs 20, the price of good A rises to Rs 3 and that of good B rises to Rs 4.50. What will be the impact of this change on the demand of the two goods?
Ans: The choice of a consumer between two normal goods, A and B, is influenced by their income and the prices of the goods. When the income of the consumer increases from Rs 10 to Rs 20, and the prices of goods A and B rise from Rs 2 to Rs 3 and Rs 3 to Rs 4.50, respectively, the impact on the demand of the two goods can be analyzed.
Initially, when the consumer’s income is Rs 10 and the prices of goods A and B are Rs 2 and Rs 3, respectively, the consumer’s budget constraint can be represented by a straight line, where good A is plotted on the horizontal axis and good B is plotted on the vertical axis. The budget constraint shows the combinations of goods A and B that the consumer can afford, given their income and the prices of the two goods.
After the consumer’s income increases to Rs 20 and the prices of goods A and B rise to Rs 3 and Rs 4.50, respectively, the budget constraint shifts outward and to the right, reflecting the fact that the consumer now has more purchasing power. However, the slope of the budget constraint also changes, as the price of good A has risen relative to the price of good B.
The change in income and prices affects the consumer’s demand for goods A and B in two ways: the substitution effect and the income effect.
The substitution effect refers to the effect of the change in the relative prices of goods A and B on the consumer’s consumption of the two goods, without considering the change in their real income. As the price of good A rises relative to the price of good B, the consumer substitutes B with A, as B becomes relatively more expensive. This results in an increase in the demand for good A and a decrease in the demand for good B.
The income effect refers to the effect of the change in the consumer’s real income on their consumption of goods A and B. As the consumer’s income increases, they have more purchasing power and can afford to consume more of both goods A and B. This results in an increase in the demand for both goods A and B.
The net effect of the change in income and prices on the demand for goods A and B depends on the relative strength of the substitution effect and the income effect. In general, if the income effect is stronger than the substitution effect, the demand for both goods A and B will increase. If the substitution effect is stronger than the income effect, the demand for good A will increase and the demand for good B will decrease.
Assignment Two
Answer the following Middle Category questions in about 250 words each. Each question carries 10 marks. Word limit does not apply in case of numerical questions. 3 × 10 = 30
3. (a) Given that a firm experiences a linear homogenous production function, comment upon the shape of the Expansion path, both in the long run and in the short run.
Ans: A linear homogenous production function refers to a production relationship where output is proportional to the inputs used in production. Given this production function, the expansion path describes the relationship between inputs and output as the firm increases its scale of production.
In the short run, the expansion path is a curved line with diminishing returns to scale. This means that as the firm increases the use of inputs, output will initially increase at an increasing rate, but eventually reach a point where the marginal product of each input will decline. This results in a declining rate of increase in output as more inputs are added, leading to a curved expansion path.
In the long run, the expansion path is a straight line. This is because in the long run, the firm can vary all its inputs, including capital, and thus achieve the optimal combination of inputs. This leads to a linear expansion path where output increases at a constant rate as inputs are added.
Overall, the shape of the expansion path depends on the availability of inputs and the firm’s ability to vary them. In the short run, the firm is constrained by fixed inputs and experiences diminishing returns, resulting in a curved expansion path. In the long run, the firm can vary all its inputs, leading to a linear expansion path.
4. a) With respect to the demand and supply analysis, discuss the Walrasian equilibrium and the Walrasian stability condition.
Ans: Walrasian equilibrium refers to a state in which the quantity of goods and services supplied equals the quantity demanded in a market. It is a central concept in demand and supply analysis, which is used to understand the determination of prices and quantities in a market economy.
The Walrasian stability condition states that if a market is in equilibrium, then a small change in the price of a good or service will not result in a change in the quantity supplied or demanded. In other words, a market is considered stable if a small disturbance in the price system leads to a return to the original equilibrium state. This means that the market is self-correcting and will return to its equilibrium state without intervention.
To reach the Walrasian equilibrium, prices must adjust until the quantity of goods and services supplied equals the quantity demanded. This can be achieved through the actions of buyers and sellers in the market. If the quantity supplied exceeds the quantity demanded, the price will fall, and suppliers will reduce production. On the other hand, if the quantity demanded exceeds the quantity supplied, the price will rise, and suppliers will increase production.
The Walrasian equilibrium and the stability condition are important concepts in the study of economics because they help to explain how prices and quantities are determined in a market economy. They also demonstrate how markets can achieve an efficient allocation of resources through the interactions of buyers and sellers, and how the market system is self-correcting in response to disturbances.
(b)The income elasticities of demand of two goods, X and Y are + 3.0 and − 0.2, respectively. Assuming income rises by 5 per cent. What will be the respective change in the quantities demanded of good X and good Y?
Ans: Income elasticity of demand measures the responsiveness of demand for a good to changes in income. If the income elasticity of demand is positive, an increase in income leads to an increase in demand for the good, while if it is negative, an increase in income leads to a decrease in demand for the good.
Given that the income elasticity of demand for good X is +3.0, a 5% increase in income will lead to a 3 times larger increase in the demand for good X. Therefore, if the original demand for good X was Q1, the new demand after the income increase will be Q1 + (3 * 0.05 * Q1) = Q1 + 0.15Q1 = 1.15Q1. So, the change in the quantity demanded of good X will be 0.15Q1.
For good Y, the income elasticity of demand is -0.2, meaning that a 5% increase in income will lead to a decrease in demand for good Y. Therefore, if the original demand for good Y was Q2, the new demand after the income increase will be Q2 – (0.2 * 0.05 * Q2) = Q2 – 0.01Q2 = 0.99Q2. So, the change in the quantity demanded of good Y will be -0.01Q2.
(c) How can the cross-price elasticity of demand be used to identify the relationship between any two goods?
Ans: Cross-price elasticity of demand measures the responsiveness of demand for one good to changes in the price of another good. This metric provides important information about the relationship between two goods and how changes in the price of one good affect demand for the other.
If the cross-price elasticity of demand is positive, the two goods are considered to be substitutes, meaning that a rise in the price of one good leads to an increase in demand for the other good. This occurs because consumers switch to the cheaper alternative when the price of one good increases. For example, if the cross-price elasticity between soft drinks and juices is positive, a rise in the price of soft drinks will increase demand for juices.
If the cross-price elasticity of demand is negative, the two goods are considered to be complements, meaning that a rise in the price of one good leads to a decrease in demand for the other good. This occurs because the two goods are used together, and a rise in the price of one good makes the combination more expensive. For example, if the cross-price elasticity between computers and computer software is negative, a rise in the price of computers will decrease demand for computer software.
The cross-price elasticity of demand can also be used to determine the extent to which a change in the price of one good will affect the demand for another good. For example, if the cross-price elasticity is -0.5, a 1% increase in the price of one good will lead to a 0.5% decrease in demand for the other good.
5. (a) Draw a concave Production Possibility curve. What does the downward slope andthe concavity of the curve imply?
Ans: The production possibility curve (PPC) is a graphical representation of the relationship between the maximum output of two goods that can be produced with limited resources. The PPC is downward sloping because as a society produces more of one good, it has to sacrifice the production of some of the other good.
A concave PPC indicates that the opportunity cost of producing more of one good increases as society produces more of it. Opportunity cost refers to the cost of producing one good in terms of the other good that must be given up. When the PPC is concave, the opportunity cost of producing more of one good increases, meaning that society has to give up an increasing amount of the other good to produce more of the first good.
The concavity of the PPC implies that the resources used in the production of the two goods are not equally efficient in producing both goods. This is because the concavity represents the diminishing marginal productivity of resources, meaning that as more resources are used to produce more of one good, the additional output produced per unit of resource decreases.
(b)Mark in the same figure, a production combination which is:
(i) feasible and not efficient.
Ans: A feasible production combination is one that can be produced using the available resources and technology. An efficient production combination is one that maximizes the output of both goods given the available resources and technology.
In a production possibility curve (PPC) diagram, a feasible production combination is represented by a point on the curve, while an efficient production combination is represented by a point on the production frontier. The production frontier is the set of all efficient production combinations and is represented by the PPC.
A production combination that is feasible but not efficient can be represented by a point inside the PPC, but not on the production frontier. This means that the economy could produce more of one good or both goods by reallocating resources more efficiently. For example, if an economy is producing a combination of goods X and Y that is inside the PPC, it could produce more of both goods by reallocating resources from the production of good X to the production of good Y.
(ii) both feasible and efficient.
Ans: A feasible production combination is one that can be produced using the available resources and technology, while an efficient production combination is one that maximizes the output of both goods given the available resources and technology.
In a production possibility curve (PPC) diagram, a feasible production combination is represented by a point on the curve, and an efficient production combination is represented by a point on the production frontier. The production frontier is the set of all efficient production combinations and is represented by the PPC.
A production combination that is both feasible and efficient can be represented by a point on the production frontier. This means that the economy is producing the maximum output of both goods given the available resources and technology. For example, if an economy is producing a combination of goods X and Y that is on the production frontier, it means that the economy is producing the maximum amount of both goods that can be produced with the available resources and technology.
(c) What could bring a leftward shift in the production possibility curve?
Ans: The production possibility curve (PPC) is a graphical representation of the maximum output of two goods that can be produced with limited resources. The PPC shows the trade-off between producing two goods and the feasibility and efficiency of production combinations. A leftward shift in the PPC indicates a decrease in the maximum output of one or both goods that can be produced with the same limited resources.
There are several factors that can bring a leftward shift in the PPC:
- Decrease in resources: A decrease in the availability of resources, such as land, labor, capital, or technology, will limit the maximum output of one or both goods that can be produced, resulting in a leftward shift in the PPC.
- Natural disasters: Natural disasters, such as hurricanes, earthquakes, or droughts, can damage or destroy resources, resulting in a decrease in the maximum output of one or both goods that can be produced.
- Technological changes: Technological changes, such as the introduction of new production methods or the obsolescence of existing technology, can alter the efficiency of resources and result in a leftward shift in the PPC.
- Changes in laws and regulations: Changes in laws and regulations, such as new environmental regulations or trade restrictions, can alter the availability or efficiency of resources and result in a leftward shift in the PPC.
Assignment Three
Answer the following Short Category questions in about 100 words each. Each question carries 6 marks. 5 × 6 = 30
6. Explain the Law of diminishing marginal utility. In what case(s) this law may not apply?
Ans: The law of diminishing marginal utility states that as a person increases the consumption of a particular good, the additional satisfaction or utility derived from each additional unit of that good will decrease. In other words, the marginal utility (the additional satisfaction from consuming one more unit of a good) will decline as the quantity consumed increases. This can be demonstrated by a downward-sloping marginal utility curve.
The law of diminishing marginal utility may not apply in certain cases, such as with luxury goods, where the additional utility derived from consuming more of the good does not decline, or with rare goods, where the utility derived from consuming the good can increase as the quantity consumed increases. Additionally, the law may not apply if a person’s preferences or tastes change over time.
7. Scarcity is the root cause for all Economic problems. Do you agree? Elaborate.
Ans: Yes, I agree that scarcity is the root cause of all economic problems. Scarcity refers to the limited availability of resources to meet the unlimited wants and needs of society. This fundamental condition creates an inherent conflict between the desire for more goods and services and the limited resources available to produce them. As a result, individuals, firms, and governments must make choices about how to allocate resources, which leads to trade-offs and the need to prioritize and prioritize needs and wants.
Economic problems such as inflation, unemployment, and inequality can be traced back to the root cause of scarcity. For example, if resources are not allocated efficiently, there may be an increase in inflation, as demand for goods outpaces supply. Unemployment can arise when the available resources are not being utilized to produce goods and services in an optimal manner. Inequality can arise when the distribution of resources is not equitable, leading to unequal access to goods and services.
8. What are the reasons behind varying returns viz., increasing, constant and decreasing returns to a factor in production?
Ans: The returns to a factor of production can vary for different reasons.
Increasing returns to a factor occur when the increase in output is greater than the increase in the quantity of a factor used. This is often seen in industries where the production process is highly specialized and economies of scale are present, resulting in lower per-unit costs as output increases.
Constant returns to a factor occur when the increase in output is equal to the increase in the quantity of a factor used. This occurs in industries with well-established production processes and low scope for further cost savings.
Decreasing returns to a factor occur when the increase in output is less than the increase in the quantity of a factor used. This can occur due to diminishing marginal returns, where the productivity of a factor decreases as more of it is added to the production process. It can also occur due to physical or technical constraints, such as limited space or the use of less efficient methods of production.
9. Discuss the shape of Input-output Isoquants.
Differentiate between
(i) Internal Economies and Internal Diseconomies of Scale.
Ans: Internal Economies of Scale and Internal Diseconomies of Scale are two opposing forces that impact the cost structure of firms as they grow.
Internal Economies of Scale refer to the benefits a firm experiences as it increases its size, leading to a decrease in average costs. These economies can arise due to specialization of labor, bulk purchasing of inputs, and sharing of infrastructure and overheads.
Internal Diseconomies of Scale, on the other hand, refer to the costs a firm experiences as it increases its size, leading to an increase in average costs. These diseconomies can arise due to factors such as increased bureaucratic inefficiencies, loss of entrepreneurial spirit, and reduced flexibility and responsiveness to market changes.
(ii) Public good and Merit good
Ans: Public goods and merit goods are two distinct types of goods in economics. Public goods are goods that are non-excludable and non-rivalrous in consumption. This means that once the good is produced, it is impossible to exclude anyone from consuming it and one person’s consumption of the good does not reduce the availability of the good for others. Examples of public goods include national defense, street lighting, and air quality.
Merit goods, on the other hand, are goods that are believed to have social benefits that outweigh the cost of producing them. Merit goods are often provided by the government because private markets may not provide enough of them to meet social needs. Examples of merit goods include education, healthcare, and public transportation.
How to Download BECC-131 Solved Assignment?
You can download it from the www.edukar.in, they have a big database for all the IGNOU solved assignments.
Is the BECC-131 Solved Assignment Free?
Yes this is absolutely free to download the solved assignment from www.edukar.in
What is the last submission date for BECC-131 Assignment?
For June Examination: 31st April, For December Examination: 30th October
")
")


 Solved Assignment 2022-2023")

")
")

")


")