Contents
- 1 Section I: Long answer questions (word limit – 500 words). Each question carries 20 marks.
- 2 1.(a) Consider an economy with only one good, food. There are three people in the economy, A, B and C. A has 400 units of food, B has 100 units, and C has only 16 units. All have the same utility, Ui =√f for i = A, B, C and where f stands for food. The social welfare function for this society is the sum of the utilities of the three individuals.
- 3 (i) The government decides to redistribute food more equally, so it takes 175 units from A and gives them to B. However, the government spoils 79 of these units in transportation, so B ultimately gets only 96 units of food. What is each person’s utility level now? Find the social welfare level in this case.
- 4 (ii) Assume now that the government considers a different redistribution scheme. Starting with the original endowments, the government takes 175 units from A. This time it wishes to give them to C, but in transportation it destroys 91 units, so C only gets 84 of these extra units. What is each person’s utility level now? Find the social welfare level in this case.
- 5 (iii) Compare parts (i) and (ii) in terms of social welfare. Explain what you infer.
- 6 (b) Explain the First theorem of welfare and Second theorem of welfare.
- 7 2. (a) What is the difference between a Dominant strategy and a Nash equilibrium?
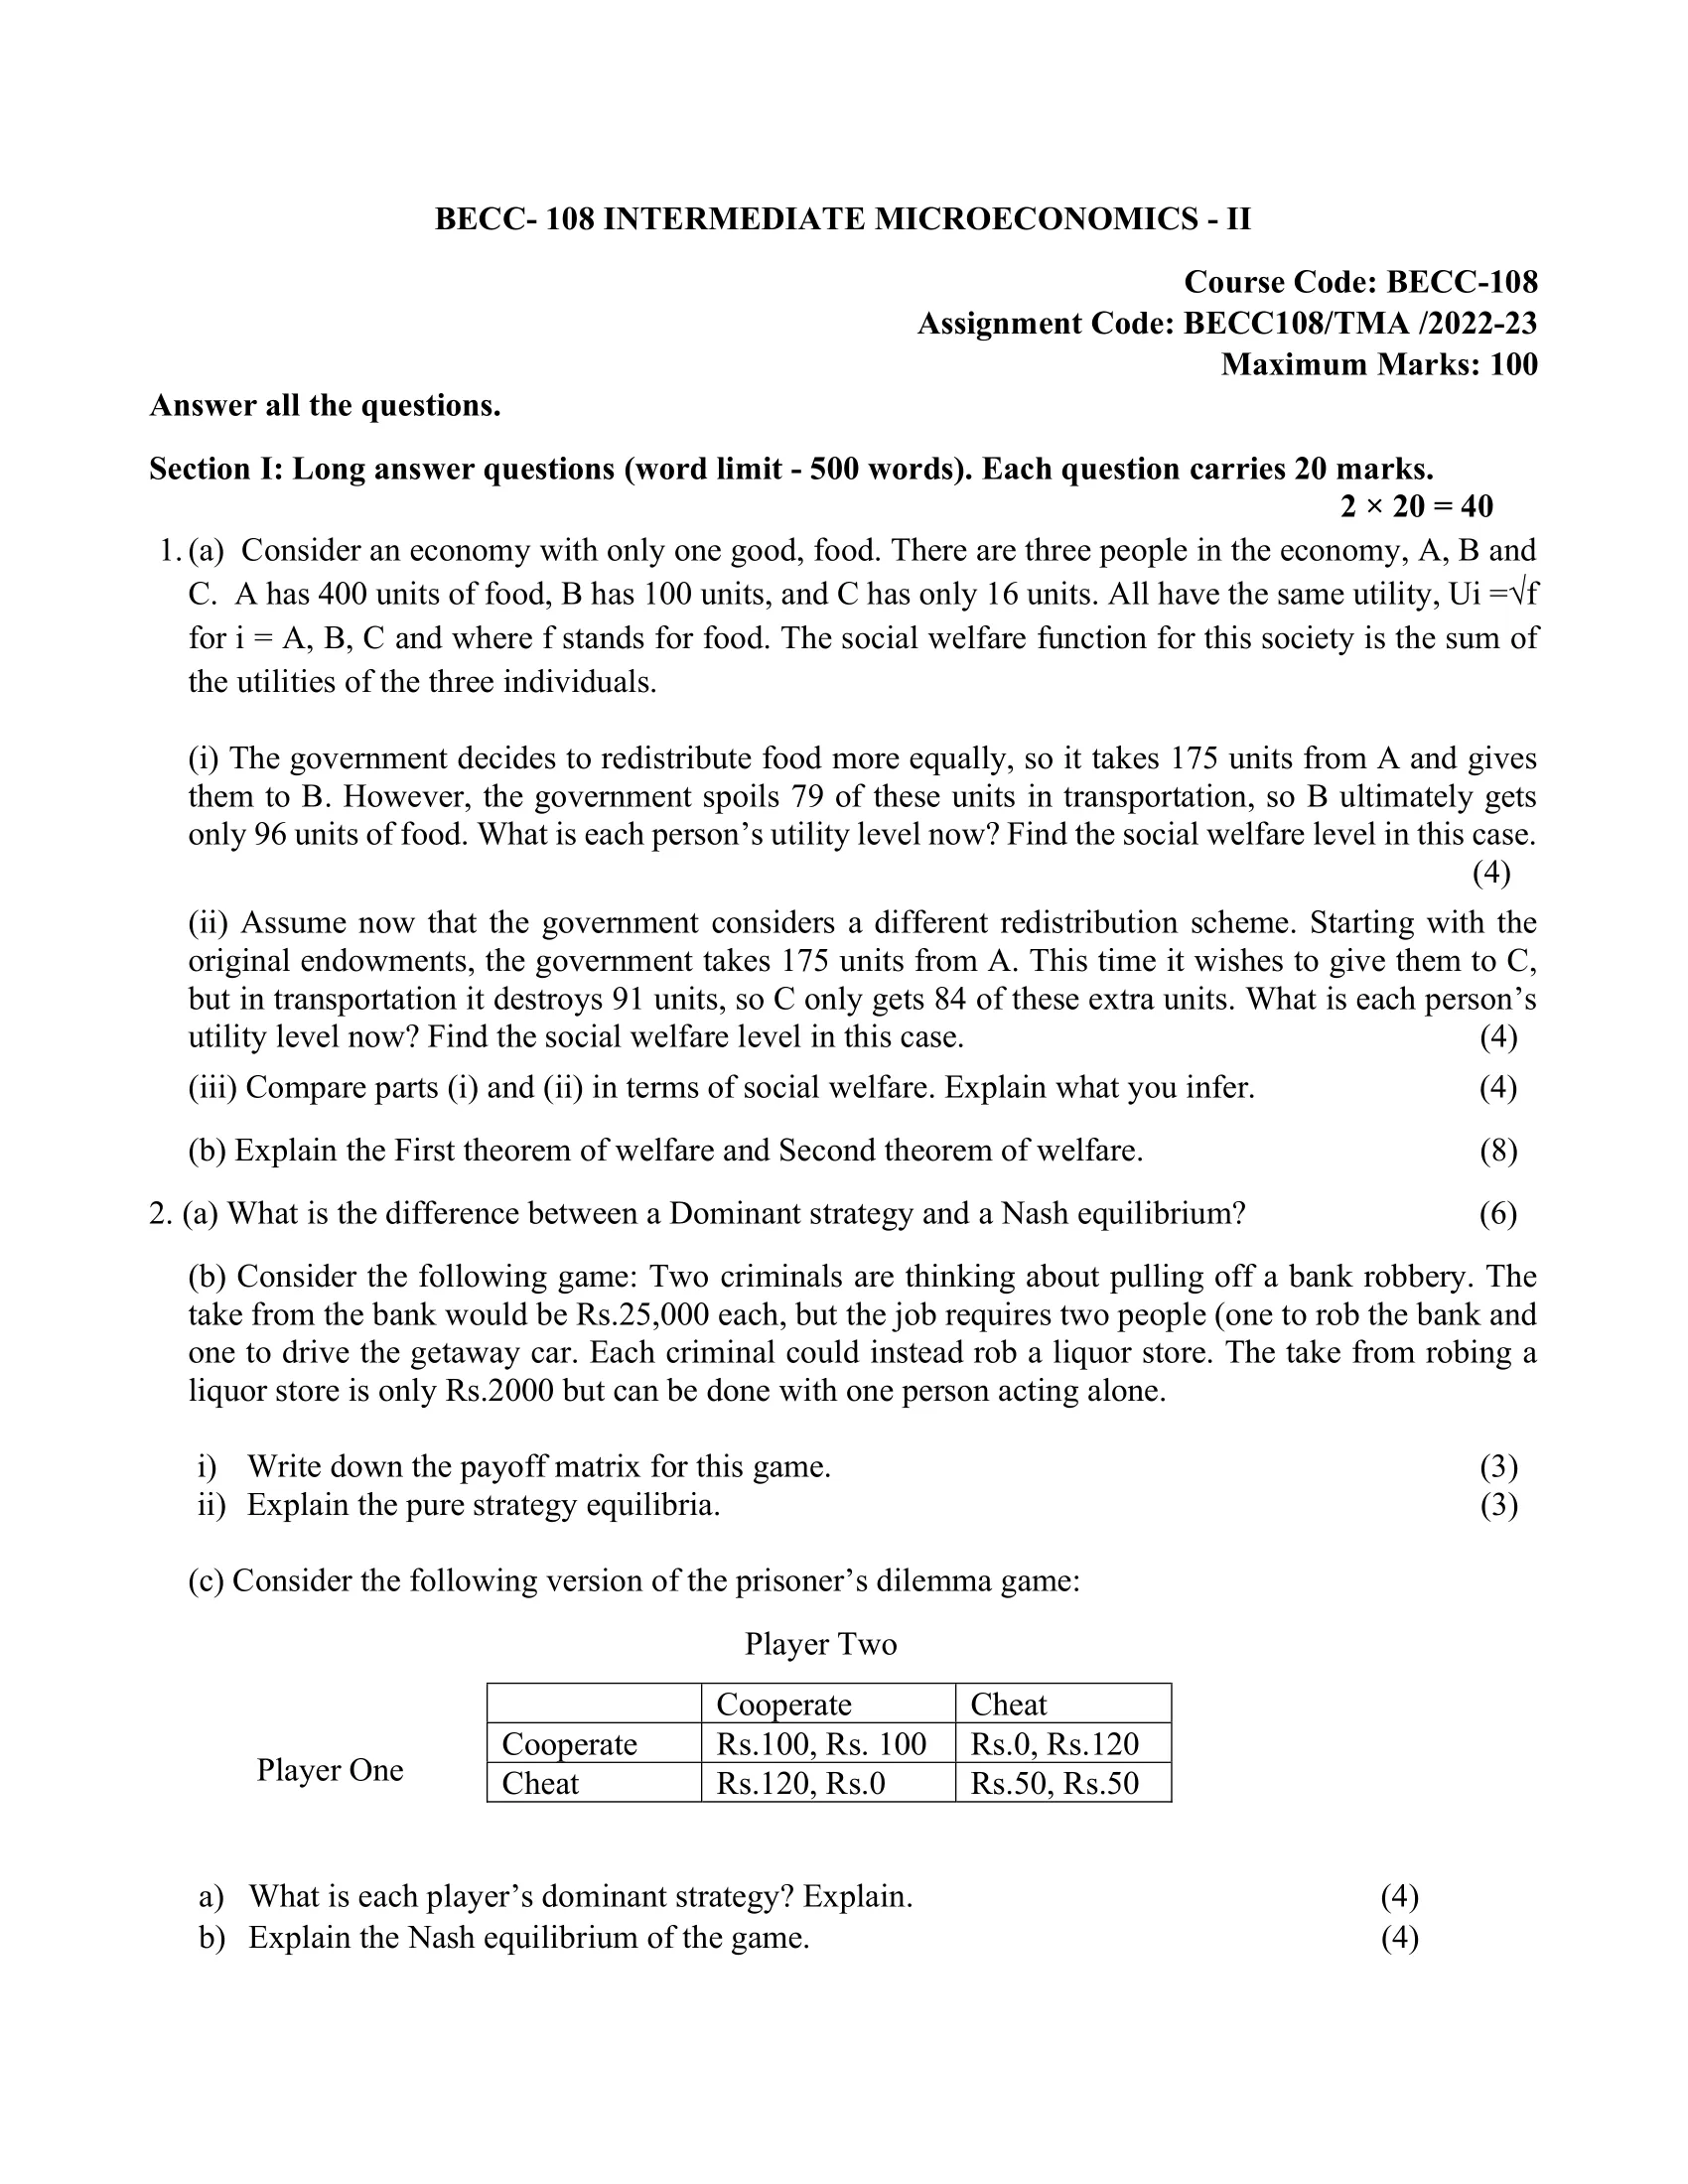
- 8 (b) Consider the following game: Two criminals are thinking about pulling off a bank robbery. The take from the bank would be Rs.25,000 each, but the job requires two people (one to rob the bank and one to drive the getaway car. Each criminal could instead rob a liquor store. The take from robing a liquor store is only Rs.2000 but can be done with one person acting alone.i) Write down the payoff matrix for this game.
- 9 ii) Explain the pure strategy equilibria.
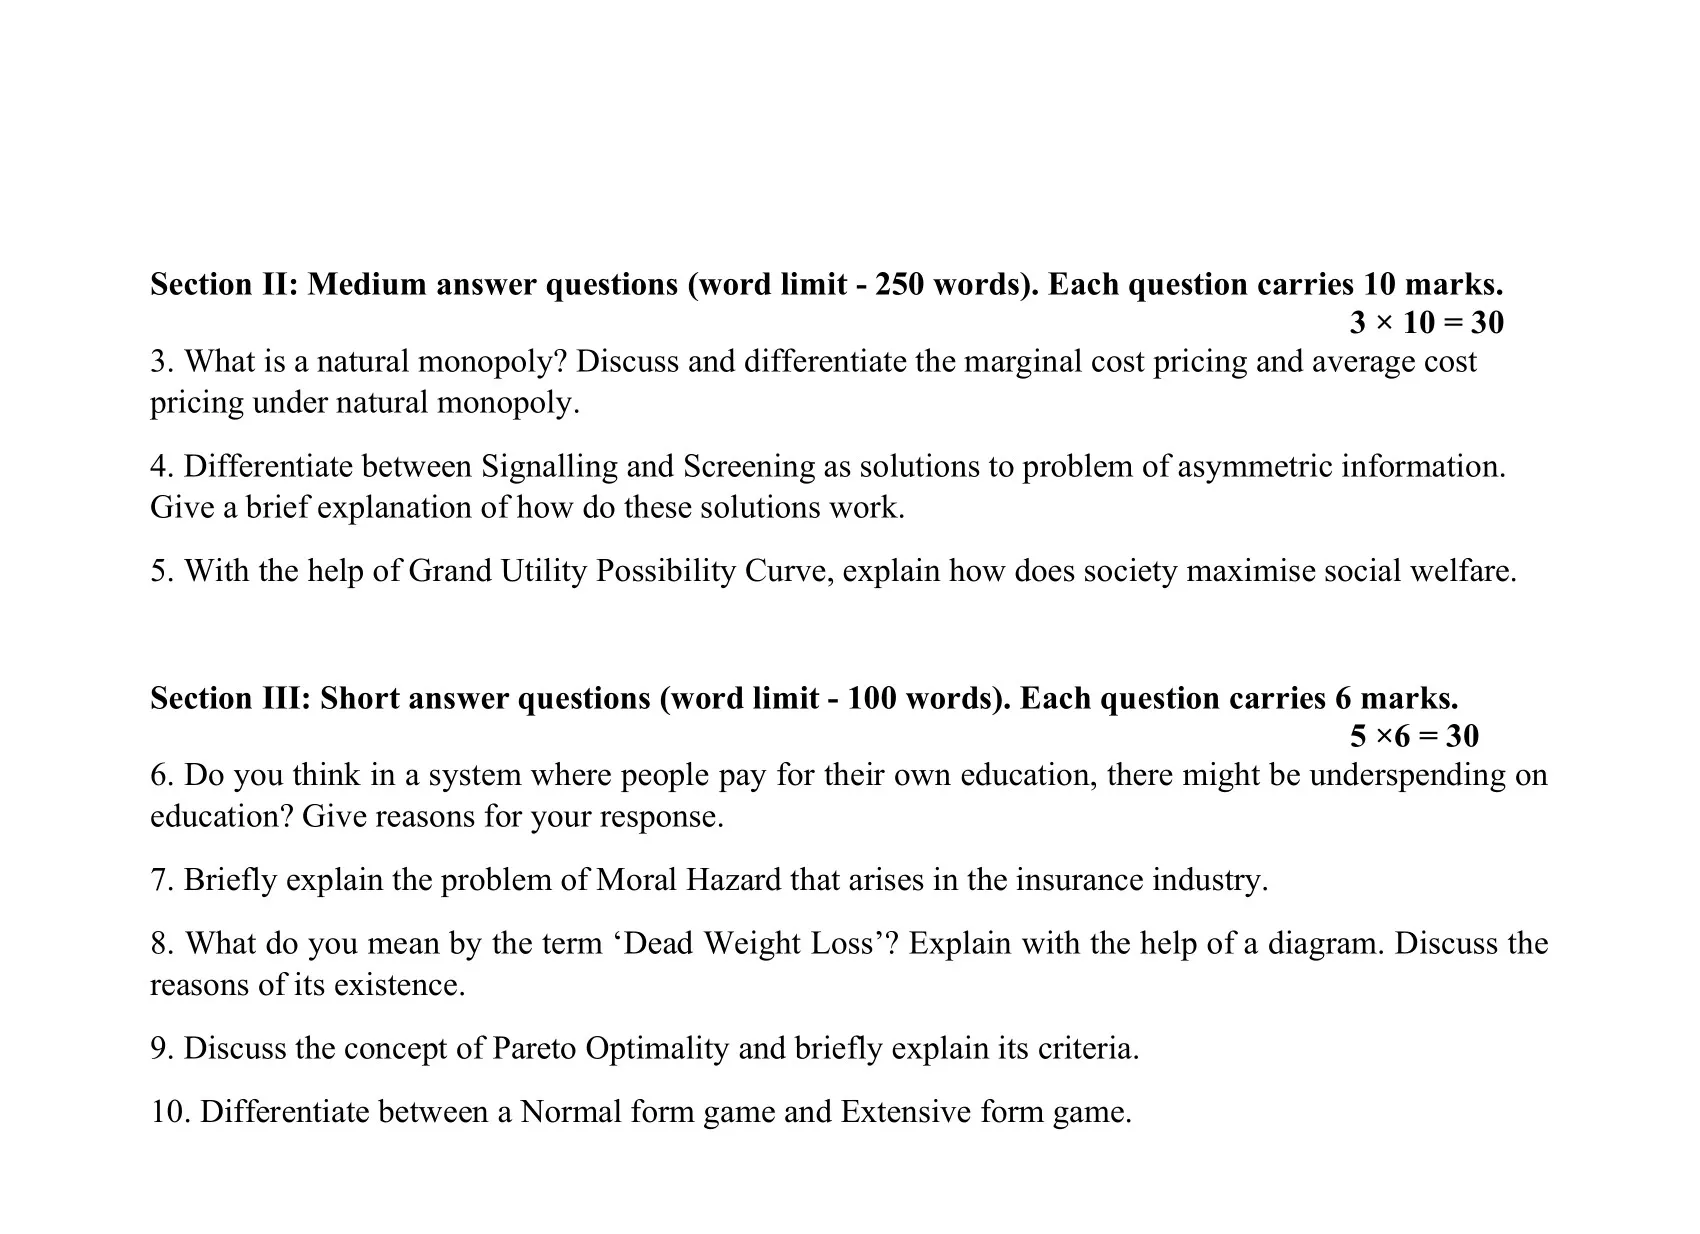
- 10 (c) Consider the following version of the prisoner’s dilemma game:
- 11 a) What is each player’s dominant strategy? Explain.
- 12 b) Explain the Nash equilibrium of the game.
- 13 Section II: Medium answer questions (word limit – 250 words). Each question carries 10 marks.
- 14 3. What is a natural monopoly? Discuss and differentiate the marginal cost pricing and average cost pricing under natural monopoly.
- 15 4. Differentiate between Signalling and Screening as solutions to problem of asymmetric information. Give a brief explanation of how do these solutions work.
- 16 5. With the help of Grand Utility Possibility Curve, explain how does society maximise social welfare.
- 17 Section III: Short answer questions (word limit – 100 words). Each question carries 6 marks.
- 18 6. Do you think in a system where people pay for their own education, there might be underspending on education? Give reasons for your response.
- 19 7. Briefly explain the problem of Moral Hazard that arises in the insurance industry.
- 20 8. What do you mean by the term ‘Dead Weight Loss’? Explain with the help of a diagram. Discuss the reasons of its existence.
- 21 9. Discuss the concept of Pareto Optimality and briefly explain its criteria.
- 22 10. Differentiate between a Normal form game and Extensive form game

| Title | BECC-108 |
| University | IGNOU |
| Degree | Bachelor Degree Programme |
| Course Code | BECC-108 |
| Course Name | INTERMEDIATE MICROECONOMICS-II |
| Programme Name | Bachelor of Arts (General) |
| Programme Code | BAG |
| Total Marks | 100 |
| Year | 2022-2023 |
| Language | English |
| Assignment Code | BECC108/TMA/2022-23 |
| Last Date for Submission of Assignment: | For June Examination: 31st April For December Examination: 30th September |
Section I: Long answer questions (word limit – 500 words). Each question carries 20 marks.
Ans: In this economy with only one good, food, the social welfare function is based on the total utility derived from the consumption of food by the three individuals. The utility function Ui = √f for i = A, B, C represents the satisfaction or happiness each individual derives from the consumption of food. The greater the quantity of food consumed, the higher the level of utility or satisfaction.
To maximize the social welfare in this economy, each individual should consume the quantity of food that maximizes their own utility. In this case, each individual should consume food such that Ui = √f is maximized. This can be achieved by increasing the consumption of food to the point where the marginal utility derived from an additional unit of food is equal to zero.
Given the initial endowments of food, the distribution of food among the three individuals will determine the level of social welfare in this economy. If individual A has 400 units of food and B has 100 units, while C has only 16 units, it is clear that C is worse off compared to A and B. To increase the level of social welfare in this economy, it is necessary to transfer food from A and B to C, such that each individual’s utility is maximized.
Suppose the initial endowments of food are such that A has 400 units, B has 100 units, and C has 16 units. To maximize the social welfare function, each individual should consume food such that Ui = √f is maximized. It can be observed that individual A has an excess of food and can afford to transfer some of their food to C. This transfer will increase C’s utility and lead to a higher level of social welfare for the entire economy.
In this example, the transfer of food from A to C can be achieved through a market exchange, where A and C can agree on a mutually beneficial price for the transfer of food. The transfer of food from A to C will result in a reallocation of food that maximizes the total utility derived from the consumption of food in the economy.
Ans: After the government’s redistribution of food, the new endowments for the three individuals are: A has 225 units of food, B has 196 units of food, and C has 16 units of food.
To calculate the new utility levels for each person, we can use the utility function Ui = √f, where f is the amount of food consumed by each person.
For individual A, their new utility level is Ua = √225 = 15.
For individual B, their new utility level is Ub = √196 = 14.
For individual C, their new utility level remains unchanged and is still equal to Uc = √16 = 4.
The new social welfare level can be calculated as the sum of the utility levels of the three individuals, which is 15 + 14 + 4 = 33.
It can be seen that the government’s attempt to redistribute food more equally has not resulted in an increase in the social welfare level. In fact, it has decreased from the initial social welfare level of 43 (15 + 14 + 14) to 33. This is because the government spoiled 79 units of food during transportation, reducing the quantity of food available for B.
Ans: After the government’s redistribution of food, the new endowments for the three individuals are: A has 225 units of food, B has 100 units of food, and C has 100 units of food (16 + 84).
To calculate the new utility levels for each person, we can use the utility function Ui = √f, where f is the amount of food consumed by each person.
For individual A, their new utility level is Ua = √225 = 15.
For individual B, their new utility level remains unchanged and is still equal to Ub = √100 = 10.
For individual C, their new utility level is Uc = √100 = 10.
The new social welfare level can be calculated as the sum of the utility levels of the three individuals, which is 15 + 10 + 10 = 35.
In this case, the government’s attempt to redistribute food more equally has led to an increase in the social welfare level from 43 (15 + 14 + 14) to 35. This is because, even though 91 units of food were destroyed in transportation, C still received 84 extra units of food, which led to an increase in their utility level.
Ans: Comparing the results of the two redistribution schemes, it can be seen that the choice of recipient greatly impacts the social welfare level. In the first scheme, where the government gave 175 units of food to B, the social welfare level decreased from 43 to 33, due to the spoilage of 79 units of food during transportation. In the second scheme, where the government gave 175 units of food to C, the social welfare level increased from 43 to 35, despite the spoilage of 91 units of food during transportation.
From this comparison, we can infer that the distribution of the extra food to C, instead of B, has a positive impact on the social welfare level of the economy. This shows that the choice of the recipient of the redistribution has a significant impact on the overall welfare of the society. In this case, giving the extra food to C has led to an increase in the social welfare level, even though a larger quantity of food was destroyed during transportation.
Moreover, this comparison highlights the importance of considering both the efficiency and the effectiveness of redistribution policies in promoting greater equality and improving the overall welfare of the society. While efficiency refers to the minimal waste of resources in carrying out the redistribution, effectiveness refers to the impact of the redistribution on the welfare of the society. Both are important considerations in designing effective redistribution policies.
(b) Explain the First theorem of welfare and Second theorem of welfare.
Ans: The First Theorem of Welfare Economics, also known as the “Fundamental Theorem of Welfare Economics,” states that a competitive market economy leads to a Pareto efficient outcome. Pareto efficiency is a concept in economics that describes a situation where no further changes can be made to improve the welfare of at least one individual without reducing the welfare of another individual.
The First Theorem of Welfare Economics states that, under certain assumptions (such as perfect competition, complete information, and the absence of externalities), a competitive market economy will lead to an allocation of resources that is Pareto efficient. In other words, in a competitive market economy, prices guide the allocation of resources such that no further changes can be made to improve the welfare of one person without reducing the welfare of another person.
The Second Theorem of Welfare Economics, also known as the “Welfare Theorem,” states that under certain conditions, any Pareto efficient outcome can be achieved through a market mechanism and a system of transfers based on lump-sum taxes and subsidies. In other words, the Second Theorem states that if the market is Pareto efficient, then it can be made Pareto optimal through appropriate government interventions, such as taxes and subsidies, without affecting the market’s efficiency.
2. (a) What is the difference between a Dominant strategy and a Nash equilibrium?
Ans: A dominant strategy and a Nash equilibrium are two concepts in game theory that describe different types of outcomes in a game with multiple players.
A dominant strategy is a strategy that is always the best choice for a player, regardless of the strategies chosen by the other players. In other words, a dominant strategy is a strategy that provides the player with the highest payoff, no matter what the other players do. A player with a dominant strategy does not need to consider the strategies of other players because their choice is independent of the strategies of others.
A Nash equilibrium, on the other hand, is a state where each player has chosen a strategy such that no player has an incentive to change their strategy given the strategies chosen by the other players. In a Nash equilibrium, each player’s strategy is the best response to the strategies chosen by the other players. A Nash equilibrium is reached when no player can increase their payoff by changing their strategy, given the strategies chosen by the other players.
In summary, a dominant strategy is a strategy that provides the best payoff for a player, regardless of the strategies chosen by the other players, while a Nash equilibrium is a state where each player has chosen a strategy such that no player has an incentive to change their strategy given the strategies chosen by the other players. The difference between these two concepts is that a dominant strategy is independent of the strategies chosen by other players, while a Nash equilibrium takes into account the strategies chosen by other players.
(b) Consider the following game: Two criminals are thinking about pulling off a bank robbery. The take from the bank would be Rs.25,000 each, but the job requires two people (one to rob the bank and one to drive the getaway car. Each criminal could instead rob a liquor store. The take from robing a liquor store is only Rs.2000 but can be done with one person acting alone.
i) Write down the payoff matrix for this game.
Ans: | Rob Bank | Rob Liquor Store
—|———-|——————-
Rob Bank | 25000, 25000 | 0, 2000
Rob Liquor Store | 2000, 0 | 2000, 2000
Here, the rows represent the strategy chosen by Criminal 1 and the columns represent the strategy chosen by Criminal 2. The numbers in the cells represent the payoffs for each criminal. The first number represents the payoff for Criminal 1, and the second number represents the payoff for Criminal 2.
For example, if both criminals choose to rob the bank, each will receive a payoff of 25,000. On the other hand, if one criminal chooses to rob the bank and the other chooses to rob a liquor store, the criminal who robs the bank will receive a payoff of 0, while the criminal who robs the liquor store will receive a payoff of 2000.
ii) Explain the pure strategy equilibria.
Ans: A pure strategy equilibrium is a state in a game where each player has chosen a specific strategy such that no player has an incentive to deviate from their strategy, given the strategies chosen by the other players. In other words, in a pure strategy equilibrium, each player’s strategy is a best response to the strategies chosen by the other players, and no player can improve their payoff by switching to a different strategy.
A pure strategy is a specific, fixed strategy that a player chooses, as opposed to a mixed strategy, where a player randomizes over several different strategies. In a pure strategy equilibrium, each player has chosen a specific pure strategy, rather than a mixed strategy.
Pure strategy equilibria are important in game theory because they provide a clear prediction of what will happen in a game, given the strategies chosen by the players. They are also useful for identifying the strategies that are likely to be chosen in a given game, based on the payoffs for each player.
In general, a game may have multiple pure strategy equilibria, or it may not have any pure strategy equilibria at all. When there are multiple pure strategy equilibria, it becomes important to determine which is most likely to be chosen by the players in a given situation. This can be done by considering the players’ preferences and the incentives they face.
(c) Consider the following version of the prisoner’s dilemma game:
| Cooperate | Rs.100, Rs. 100 | Rs.0, Rs.120 |
| Cheat | Rs.120, Rs.0 | Rs.50, Rs.50 |
Ans: The prisoner’s dilemma is a classic example of a game analyzed in game theory that shows how two individuals may not cooperate, even if it appears that it is in their best interest to do so.
In the version you described, if both players cooperate, each player receives a reward of Rs.100. If both players cheat, each player receives a reward of Rs.50. However, if one player cheats and the other cooperates, the player who cheats receives a reward of Rs.120 while the cooperating player receives a reward of Rs.0.
This creates a dilemma, as both players have an incentive to cheat in order to maximize their own reward, even though they would both be better off if they both cooperated. The result is that both players end up with a lower reward than they would have if they both cooperated.
This demonstrates how individual self-interest can lead to suboptimal outcomes for all participants in a game.
a) What is each player’s dominant strategy? Explain.
Ans: In the prisoner’s dilemma game, a dominant strategy is a strategy that provides the highest reward for a player, regardless of the actions taken by the other player.
In the version you described, each player has a dominant strategy of cheating. This is because regardless of the action taken by the other player, cheating provides a higher reward than cooperating. If one player cheats, the other player receives a reward of Rs.0, while if both players cooperate, each player receives a reward of Rs.100. In both cases, cheating provides a higher reward of Rs.120.
Therefore, each player’s dominant strategy is to cheat, even though both players would be better off if they both cooperated. This result demonstrates the classic prisoner’s dilemma problem, where individual self-interest can lead to suboptimal outcomes for both players.
b) Explain the Nash equilibrium of the game.
Ans: The Nash Equilibrium is a concept in game theory, named after the Nobel Prize-winning economist John Nash. It refers to a state in which each player in a game has chosen the best possible strategy given the strategies of all the other players in the game. In this state, no player has an incentive to change their strategy, as doing so would result in a worse outcome for them.
Formally, a Nash Equilibrium is defined as a set of strategies, one for each player, such that each player’s strategy is a best response to the strategies of the other players. In other words, if all the players in the game follow their strategies in the Nash Equilibrium, none of them would benefit by unilaterally changing their strategy.
The Nash Equilibrium is an important concept in the study of game theory, as it provides a way to predict the outcome of a game given the motivations and actions of the players. It is used in many fields, including economics, political science, and psychology, to understand the behavior of individuals in strategic situations.
Section II: Medium answer questions (word limit – 250 words). Each question carries 10 marks.
3. What is a natural monopoly? Discuss and differentiate the marginal cost pricing and average cost pricing under natural monopoly.
Ans: A natural monopoly is a market structure where a single firm is the most efficient producer of a good or service, resulting in a lower average cost compared to other firms. This occurs when the economies of scale of the dominant firm are so large that the average cost of producing a good or service decreases as the firm’s output increases, leading to an overall lower cost of production compared to any potential competitors. Examples of natural monopolies include utilities such as water and electricity, as well as transport services such as railroads and pipelines.
When it comes to pricing strategies for natural monopolies, two approaches are used: marginal cost pricing and average cost pricing.
Marginal cost pricing is a pricing strategy where the price of a good or service is set at the level of its marginal cost, which is the cost of producing one additional unit of the good or service. This approach aims to maximize the efficiency of the market by ensuring that the price of the good or service reflects its true cost of production. In the case of natural monopolies, marginal cost pricing can be difficult to implement because the cost of producing one additional unit may not accurately reflect the overall cost structure of the dominant firm.
Average cost pricing, on the other hand, is a pricing strategy where the price of a good or service is set at the average cost of production. This approach aims to balance the interests of both the firm and the consumer by ensuring that the firm can cover its costs while still providing the good or service at a price that is affordable for consumers. Average cost pricing is often used for natural monopolies because the average cost of production is more representative of the overall cost structure of the dominant firm compared to marginal cost pricing.
4. Differentiate between Signalling and Screening as solutions to problem of asymmetric information. Give a brief explanation of how do these solutions work.
Ans: Signaling and screening are two solutions to the problem of asymmetric information, which occurs when one party to a transaction has more information about the quality of a good or service than the other party.
Signaling refers to a situation where a party provides information about the quality of a good or service to the other party through a signal, such as a warranty, a brand name, or a certification. The idea behind signaling is that a signal of high quality can increase the perceived value of the good or service, and therefore make it more attractive to the buyer. For example, a warranty on a product can signal to the buyer that the manufacturer is confident in the quality of the product and is willing to stand behind it.
Screening, on the other hand, refers to a situation where a party uses information to determine the quality of a good or service before entering into a transaction. Screening can take many forms, such as background checks, credit checks, or reference checks. The idea behind screening is that a party can use the information it has to assess the quality of the good or service and to determine whether it is worth entering into a transaction. For example, an employer might perform a background check on a job applicant to determine if the applicant has a criminal record or a history of poor performance on the job.
Ans: The Grand Utility Possibility Curve (GUPC) is a graphical representation of the trade-offs between two or more goods that a society can produce and consume. The curve shows the different combinations of goods that a society can produce, given its available resources and technology.
In a market economy, the goal is to maximize social welfare, which is the sum of the individual utilities of all members of society. The GUPC can be used to illustrate how society can achieve this goal by allocating its resources efficiently.
To maximize social welfare, society must produce the combination of goods that is on the highest attainable point on the GUPC. This is because the highest attainable point represents the combination of goods that generates the greatest level of satisfaction for society as a whole. If society produces a combination of goods that is on a lower point on the GUPC, then it is not using its resources efficiently and could produce more of one good at the expense of less of another good, leading to an overall increase in social welfare.
In addition, the GUPC also shows the trade-offs that society faces when it decides to produce more of one good and less of another. This trade-off is represented by the slope of the GUPC, which shows the opportunity cost of producing one good in terms of the other. The opportunity cost is the next best alternative use of the resources, and it is important for society to consider when making decisions about how to allocate its resources.
Section III: Short answer questions (word limit – 100 words). Each question carries 6 marks.
6. Do you think in a system where people pay for their own education, there might be underspending on education? Give reasons for your response.
Ans: Yes, in a system where people pay for their own education, there might be underspending on education. This is because some individuals, especially those from low-income backgrounds, may not have the financial resources to pay for their education, leading to a lack of investment in human capital. Additionally, individuals may also be uncertain about the future returns on their education, causing them to be risk-averse and not invest in their own education. This can lead to a situation where the overall spending on education is lower than what is optimal for society as a whole, leading to an underspending on education.
7. Briefly explain the problem of Moral Hazard that arises in the insurance industry.
Ans: Moral hazard is a problem that arises in the insurance industry when insured individuals take on more risk than they would without insurance. This occurs because insured individuals are shielded from the full consequences of their actions by the insurance coverage, leading them to act in a way that increases the likelihood of an insurance claim.
For example, if an individual has car insurance, they may be less cautious when driving because they know that any damages incurred in an accident will be covered by their insurance. This can result in more accidents, which increase the cost of insurance for everyone.
Moral hazard also arises in the context of health insurance. Individuals who have health insurance may be less likely to take steps to maintain their health or to seek preventative care because they know that their insurance will cover the cost of medical treatment if they become sick.
8. What do you mean by the term ‘Dead Weight Loss’? Explain with the help of a diagram. Discuss the reasons of its existence.
Ans: Dead weight loss is a term used in economics to describe the reduction in social welfare that occurs as a result of market inefficiency. It refers to the loss of economic surplus that results when the market fails to allocate resources optimally.
Dead weight loss can be illustrated using a supply and demand diagram. The intersection of the supply and demand curves represents the market equilibrium, where the quantity of a good or service produced is equal to the quantity demanded. In a perfectly competitive market, this intersection would also be the efficient outcome, where all available resources are utilized to produce the good or service.
However, in some cases, market inefficiencies such as taxes, subsidies, price floors, or price ceilings can cause the market to deviate from its equilibrium. For example, if a tax is imposed on a good, the supply curve will shift upward, causing the market price to increase. This leads to a reduction in the quantity demanded and a surplus of the good, leading to a dead weight loss represented by the triangular area between the original demand curve and the new market price.
The reasons for the existence of dead weight loss are various market failures, such as market power, externalities, information asymmetry, and public goods. These failures can result in market prices that are different from the true social cost or benefit of producing or consuming a good or service, leading to an inefficient allocation of resources.
9. Discuss the concept of Pareto Optimality and briefly explain its criteria.
Ans: Pareto optimality is a concept in economics that refers to a state of affairs in which it is impossible to make one person better off without making someone else worse off. In other words, it is a measure of efficiency in resource allocation, where a situation is considered Pareto optimal if there is no further improvement that can be made without making someone worse off.
The concept of Pareto optimality is named after Italian economist Vilfredo Pareto, who developed the idea in the late 19th and early 20th centuries. Pareto optimality is often used as a benchmark for evaluating economic policy, as it provides a useful way of measuring whether a change in the economy will make society as a whole better or worse off.
The criteria for Pareto optimality are straightforward: a situation is considered Pareto optimal if there is no way to reallocate resources in such a way that at least one person is made better off without making someone else worse off. In other words, if a change would make at least one person better off and no one worse off, the situation is not Pareto optimal.
10. Differentiate between a Normal form game and Extensive form game
Ans: Normal form games and extensive form games are two ways of representing game theory scenarios in economics.
Normal form games are used to represent games of pure strategy, where players have a set of predetermined options and make a single move at the same time. The normal form game is represented by a matrix, where the rows represent the choices of one player and the columns represent the choices of the other player. The entries in the matrix represent the payoffs for each player, given the combination of moves made by both players.
On the other hand, extensive form games are used to represent games of imperfect information, where players take turns making decisions and have the ability to observe each other’s actions. The extensive form game is represented by a tree diagram, where each node represents a decision point and the branches represent the possible moves that a player can make. The payoffs for each player are represented at the endpoints of the tree, where the final outcome of the game is determined.
How to Download BECC-108 Solved Assignment?
You can download it from the www.edukar.in, they have a big database for all the IGNOU solved assignments.
Is the BECC-108 Solved Assignment Free?
Yes this is absolutely free to download the solved assignment from www.edukar.in
What is the last submission date for BECC-108 Solved Assignment?
For June Examination: 31st April, For December Examination: 30th October
")
")

")

")
")


")


 2022-2023")