Contents
- 1 Part A-Assignment One
- 2 Answer the following questions in about 500 words each (wherever applicable).Each question carries 20 marks.
- 3 1. Explain the role of statistics in research.
- 4 2. Compute Spearman’s rho for the following data:
- 5 Assignment Two
- 6 Answer the following questions in about 100 words each (wherever applicable). Each question carries 5 marks.
- 7 3. Explain the scales of measurement with the help of examples.
- 8 4. Compute mean, median and mode for the following data:
- 9 5. Explain the merits, limitations and uses of average deviation.
- 10 6. Compute standard deviation for the following data.
- 11 7. What is correlation? Describe the other methods of correlation with the help of suitable examples.
- 12 8. Explain the concept, properties and uses of z scores.
- 13 PART B-TUTORIAL
| Title | BPCC-104: IGNOU BAG Solved Assignment 2022-2023 |
| University | IGNOU |
| Degree | Bachelor Degree Programme |
| Course Code | BPCC-104 |
| Course Name | STATISTICAL METHODS FOR PSYCHOLOGICAL RESERACH- I |
| Programme Name | Bachelor of Arts (General) |
| Programme Code | BAG |
| Total Marks | 100 |
| Year | 2022-2023 |
| Language | English |
| Assignment Code | Asst /TMA /July 2022-January 2023 |
| Last Date for Submission of Assignment: | For June Examination: 31st April For December Examination: 30th September |
Part A-Assignment One
Answer the following questions in about 500 words each (wherever applicable).
Each question carries 20 marks.
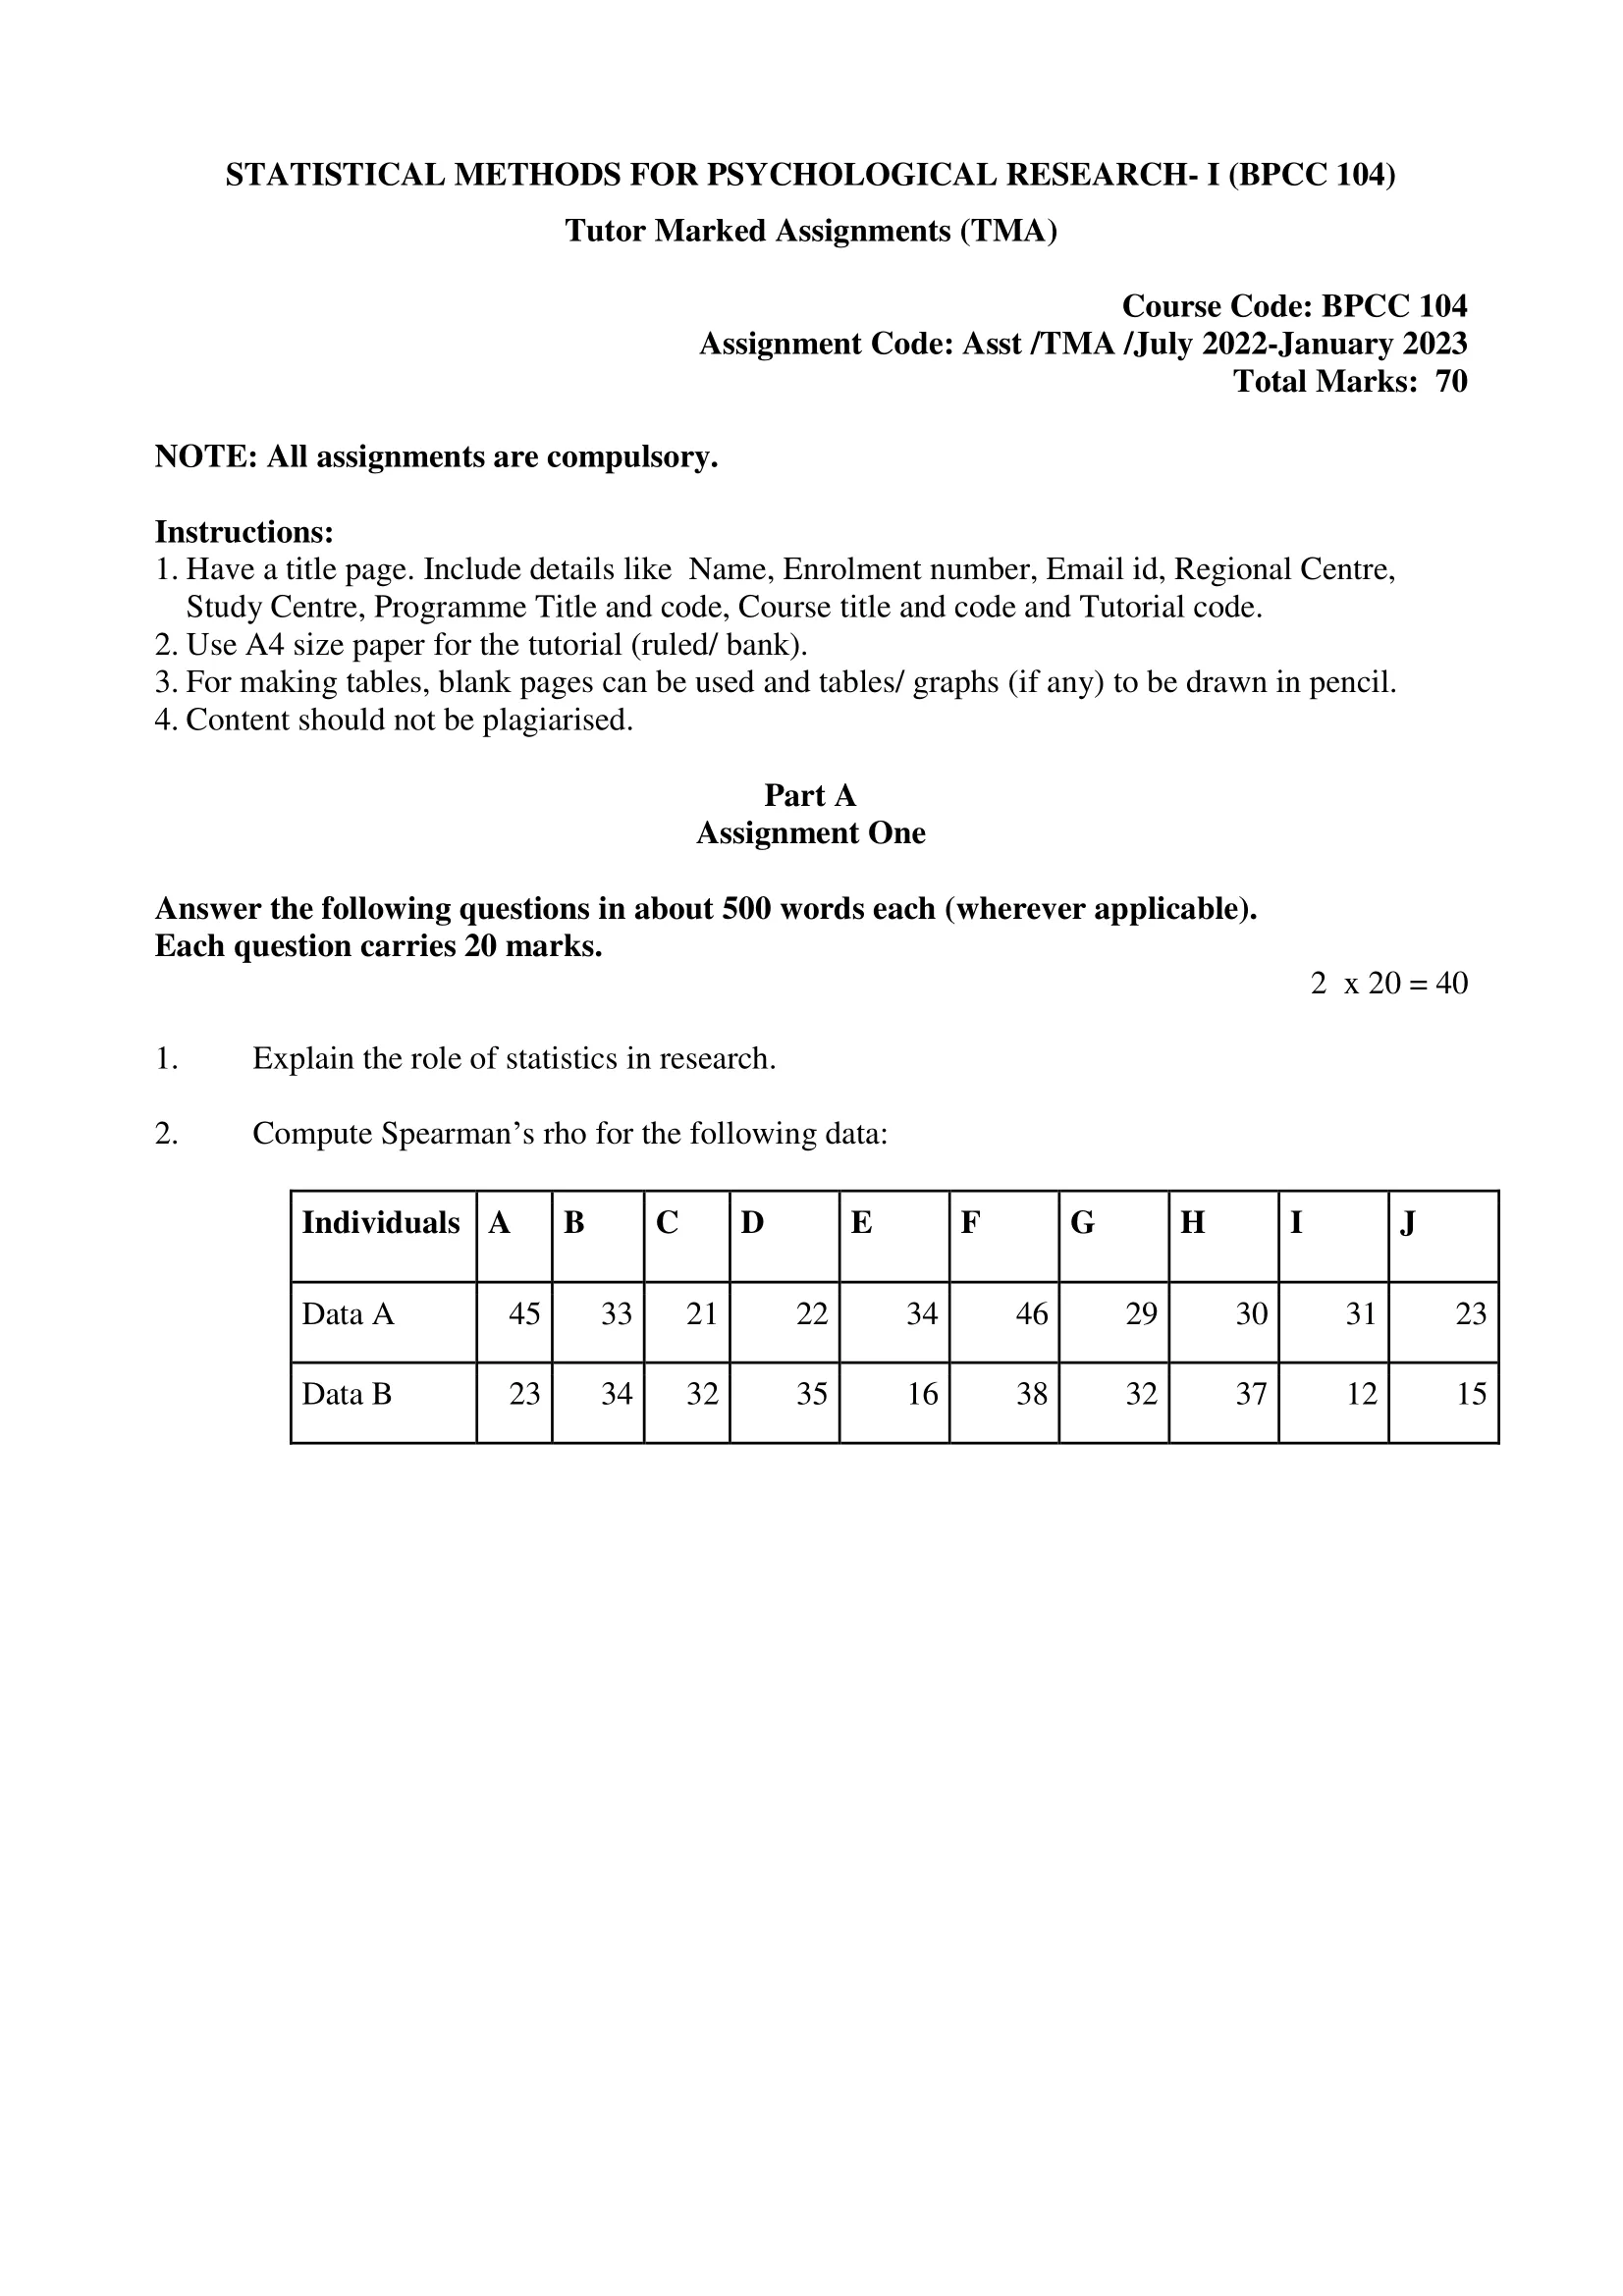
1. Explain the role of statistics in research.
Ans: Statistics plays a crucial role in research. It provides a means of quantitatively summarizing and analyzing data, which is essential for drawing valid conclusions and making informed decisions. In research, statistics can be used to describe the data, test hypotheses, and make predictions about future outcomes.
One of the primary uses of statistics in research is to describe and summarize data. This involves calculating various measures of central tendency, such as the mean, median, and mode, as well as measures of variability, such as standard deviation and variance. These statistics provide a way to characterize the data and understand its distribution.
Another key role of statistics in research is hypothesis testing. Hypothesis testing is used to determine whether an observed effect is statistically significant, meaning that it is unlikely to have occurred by chance. This involves formulating a null hypothesis and an alternative hypothesis and using statistical tests to determine which is more likely to be true. If the null hypothesis is rejected, it suggests that there is a significant difference or effect that warrants further investigation.
Statistics can also be used for prediction. This involves using data to make informed predictions about future outcomes. For example, a business might use sales data from previous years to forecast future sales and plan accordingly. Predictive models can be developed using statistical techniques such as regression analysis, time series analysis, and machine learning.
In addition to these roles, statistics can also help researchers design experiments and surveys. By determining the appropriate sample size, selecting a random sample, and minimizing bias, statistics can improve the accuracy and reliability of research findings. Statistical methods can also be used to analyze data from surveys and experiments, allowing researchers to draw valid conclusions and make recommendations based on the results.
2. Compute Spearman’s rho for the following data:
| Individuals | A | B | C | D | E | F | G | H | I | J |
|---|---|---|---|---|---|---|---|---|---|---|
| Data A | 45 | 33 | 21 | 22 | 34 | 46 | 29 | 30 | 31 | 23 |
| Data B | 23 | 34 | 32 | 35 | 16 | 38 | 32 | 37 | 12 | 15 |
Ans: To compute Spearman’s rho for this data, we need to first rank the values in each dataset, then calculate the difference between the ranks for each pair of observations. Spearman’s rho is then the correlation coefficient between these rank differences in the two datasets.
Using the data provided, we can rank each observation in each dataset:
Individuals A B C D E F G H I J Data A 45 33 21 22 34 46 29 30 31 23 Rank A 6 3 1 2 4 7 2 3 5 1
Individuals A B C D E F G H I J Data B 23 34 32 35 16 38 32 37 12 15 Rank B 4 7 5 8 1 9 5 10 2 3
Next, we calculate the difference in ranks for each pair of observations:
Individuals A B C D E F G H I J Rank A 6 3 1 2 4 7 2 3 5 1 Rank B 4 7 5 8 1 9 5 10 2 3 Rank Diff. 2 -4 -4 -6 3 -2 -3 -7 3 -2
Then, we calculate the sum of the squared rank differences:
Sum of squared rank differences = 2^2 + (-4)^2 + (-4)^2 + (-6)^2 + 3^2 + (-2)^2 + (-3)^2 + (-7)^2 + 3^2 + (-2)^2 = 130
Finally, we can use the formula for Spearman’s rho to calculate the correlation coefficient:
rho = 1 – (6 * 130) / (10 * (10^2 – 1)) = 1 – (780) / (990) = 1 – 0.7879 = 0.2121
Therefore, the value of Spearman’s rho for this data is 0.2121. Since this value is close to 0, it suggests that there is little to no correlation between the two datasets.
Assignment Two
Answer the following questions in about 100 words each (wherever applicable). Each question carries 5 marks.
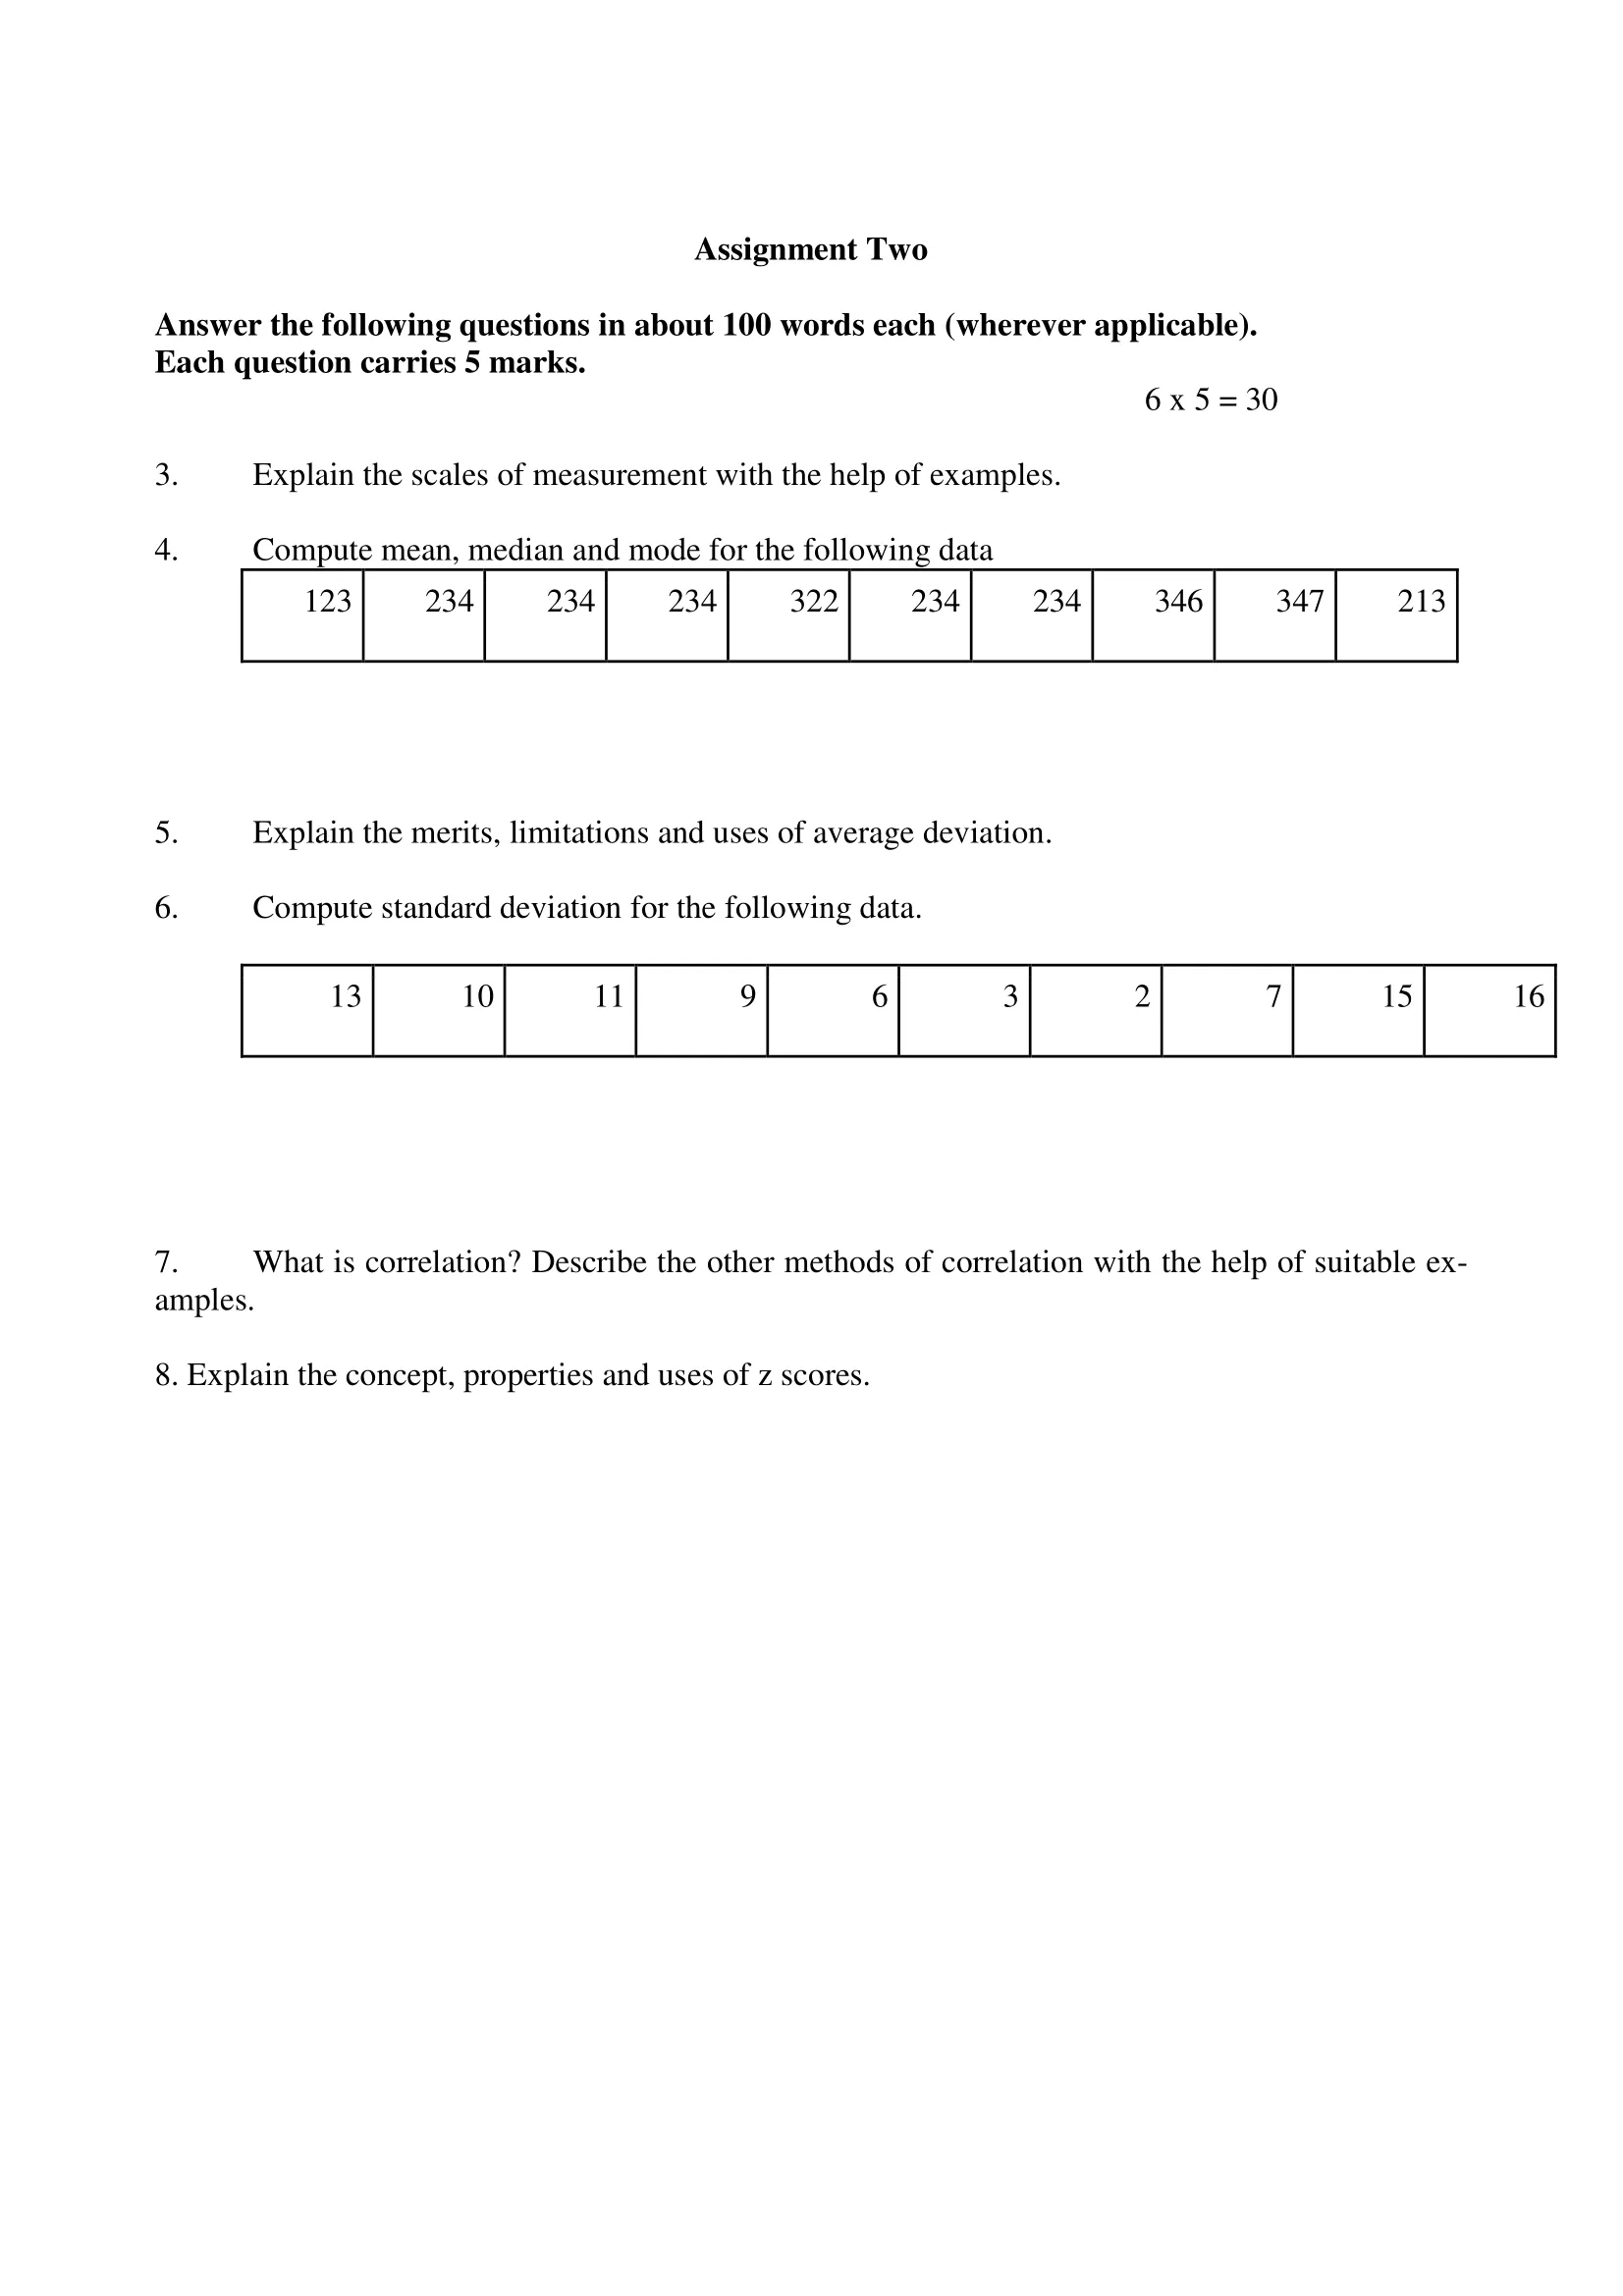
3. Explain the scales of measurement with the help of examples.
Ans: In statistics, scales of measurement refer to the different ways in which data can be measured and categorized. There are four primary scales of measurement: nominal, ordinal, interval, and ratio.
- Nominal Scale: This is the simplest scale of measurement, where data is categorized into non-overlapping groups or categories. Examples of nominal scale data include gender, race, or blood type. These categories cannot be ranked or ordered, but they can be counted.
- Ordinal Scale: Data measured on an ordinal scale can be ranked and ordered, but the distance between categories is not equal. For example, a Likert scale, where participants indicate their level of agreement or disagreement on a statement, is an ordinal scale. The categories “strongly agree,” “agree,” “disagree,” and “strongly disagree” can be ordered, but the distance between “strongly agree” and “agree” may not be the same as the distance between “disagree” and “strongly disagree.”
- Interval Scale: Data on an interval scale has equal intervals between categories, but there is no true zero point. For example, the Fahrenheit temperature scale is an interval scale, where the distance between 30 and 40 degrees is the same as the distance between 70 and 80 degrees, but 0 degrees does not represent a complete absence of temperature.
- Ratio Scale: A ratio scale has equal intervals between categories, and there is a true zero point. Examples of ratio scale data include height, weight, and time. Zero represents a complete absence of the measured variable, and ratios between measurements can be calculated. For example, a person who weighs 80 kilograms weighs twice as much as a person who weighs 40 kilograms.
4. Compute mean, median and mode for the following data:
| 123 | 234 | 234 | 234 | 322 | 234 | 234 | 346 | 347 | 213 |
Ans. To calculate the mean, we sum up all the data points and divide by the number of data points:
Mean = (123 + 234 + 234 + 234 + 322 + 234 + 234 + 346 + 347 + 213) / 10 = 254.7
To calculate the median, we need to find the middle value in the sorted data set. First, let’s put the data in order:
123 213 234 234 234 234 322 346 347
The median is the middle value, which is 234.
To calculate the mode, we need to find the most frequently occurring value in the data set. In this case, the mode is also 234, since it appears most frequently (occurring 4 times).
So, the mean is 254.7, the median is 234, and the mode is 234.
5. Explain the merits, limitations and uses of average deviation.
Ans: The average deviation is a measure of variability that calculates the average absolute difference between each data point and the mean of the data set. It has several merits, limitations, and uses, as explained below:
Merits:
- It considers each data point in the dataset, giving a more accurate representation of the variability of the data.
- It is relatively easy to calculate compared to other measures of variability, such as standard deviation.
- It can be used with any scale of measurement, including nominal and ordinal data.
Limitations:
- It does not take into account the direction of the deviations, only their magnitude. This can be a problem if some of the data points are much larger or smaller than the others.
- It is sensitive to extreme values (outliers) in the data set, which can distort the measure of variability.
- It may not be suitable for data with a skewed distribution, as the deviations from the mean may not be symmetrical.
Uses:
- Average deviation can be used to compare the variability of two or more datasets.
- It can be used as a descriptive statistic to summarize the variability of a dataset.
- It can be used as a basis for other statistical calculations, such as calculating the variance and standard deviation.
6. Compute standard deviation for the following data.
| 13 | 10 | 11 | 9 | 6 | 3 | 2 | 7 | 15 | 16 |
Ans: To calculate the standard deviation, we need to first find the mean of the data:
Mean = (13 + 10 + 11 + 9 + 6 + 3 + 2 + 7 + 15 + 16) / 10 = 9.2
Next, we find the deviation of each data point from the mean, by subtracting the mean from each data point:
(13 – 9.2) = 3.8 (10 – 9.2) = 0.8 (11 – 9.2) = 1.8 (9 – 9.2) = -0.2 (6 – 9.2) = -3.2 (3 – 9.2) = -6.2 (2 – 9.2) = -7.2 (7 – 9.2) = -2.2 (15 – 9.2) = 5.8 (16 – 9.2) = 6.8
Then, we square each deviation:
3.8^2 = 14.44 0.8^2 = 0.64 1.8^2 = 3.24 (-0.2)^2 = 0.04 (-3.2)^2 = 10.24 (-6.2)^2 = 38.44 (-7.2)^2 = 51.84 (-2.2)^2 = 4.84 5.8^2 = 33.64 6.8^2 = 46.24
Next, we take the average of these squared deviations, also known as the variance:
Variance = (14.44 + 0.64 + 3.24 + 0.04 + 10.24 + 38.44 + 51.84 + 4.84 + 33.64 + 46.24) / 10 = 23.76
Finally, we take the square root of the variance to get the standard deviation:
Standard deviation = √23.76 = 4.875
So, the standard deviation of the given data is 4.875.
7. What is correlation? Describe the other methods of correlation with the help of suitable examples.
Ans: Correlation is a statistical measure that shows the degree of association or relationship between two variables. It indicates how strongly the two variables are related and the direction of that relationship. A positive correlation means that as one variable increases, so does the other variable. A negative correlation means that as one variable increases, the other variable decreases.
There are several methods of correlation, including:
- Pearson’s correlation coefficient: Pearson’s correlation coefficient measures the strength and direction of the linear relationship between two continuous variables. It ranges from -1 to 1, with -1 indicating a perfect negative correlation, 0 indicating no correlation, and 1 indicating a perfect positive correlation. For example, Pearson’s correlation coefficient can be used to measure the relationship between the height and weight of a group of individuals.
- Spearman’s rank correlation coefficient: Spearman’s rank correlation coefficient measures the strength and direction of the relationship between two variables that are measured on an ordinal or rank scale. It is based on the ranks of the data rather than the actual values. Spearman’s correlation coefficient ranges from -1 to 1, with the same interpretation as Pearson’s correlation coefficient. For example, Spearman’s correlation coefficient can be used to measure the relationship between the rankings of students on two different tests.
- Kendall’s tau correlation coefficient: Kendall’s tau correlation coefficient is another method of measuring the relationship between two variables that are measured on an ordinal or rank scale. It also uses the ranks of the data rather than the actual values. Kendall’s tau correlation coefficient ranges from -1 to 1, with the same interpretation as the other correlation coefficients. For example, Kendall’s tau correlation coefficient can be used to measure the relationship between the rankings of different brands of a product based on customer satisfaction.
8. Explain the concept, properties and uses of z scores.
Ans: Z-score is a statistical measure that indicates how far a data point is from the mean of a distribution in terms of standard deviation. It allows us to standardize different data sets so that they can be compared on the same scale.
The formula for calculating the z-score is:
z = (x – mean) / standard deviation
Where x is the value of the data point, mean is the mean of the distribution, and standard deviation is the standard deviation of the distribution.
Properties of z-scores include:
- The mean of the z-scores is always 0.
- The standard deviation of the z-scores is always 1.
- The distribution of z-scores is always normal.
Uses of z-scores include:
- Comparison of data from different distributions: By standardizing different data sets with z-scores, we can compare them on the same scale, even if they have different units of measurement or different means and standard deviations.
- Identifying outliers: Data points with extreme z-scores (i.e., values that are several standard deviations from the mean) can be identified as outliers, which may indicate errors in data collection or interesting phenomena that deserve further investigation.
- Hypothesis testing: Z-scores are often used in hypothesis testing to determine whether a data point is within a certain range of values or falls outside that range, and if so, whether that deviation is statistically significant.
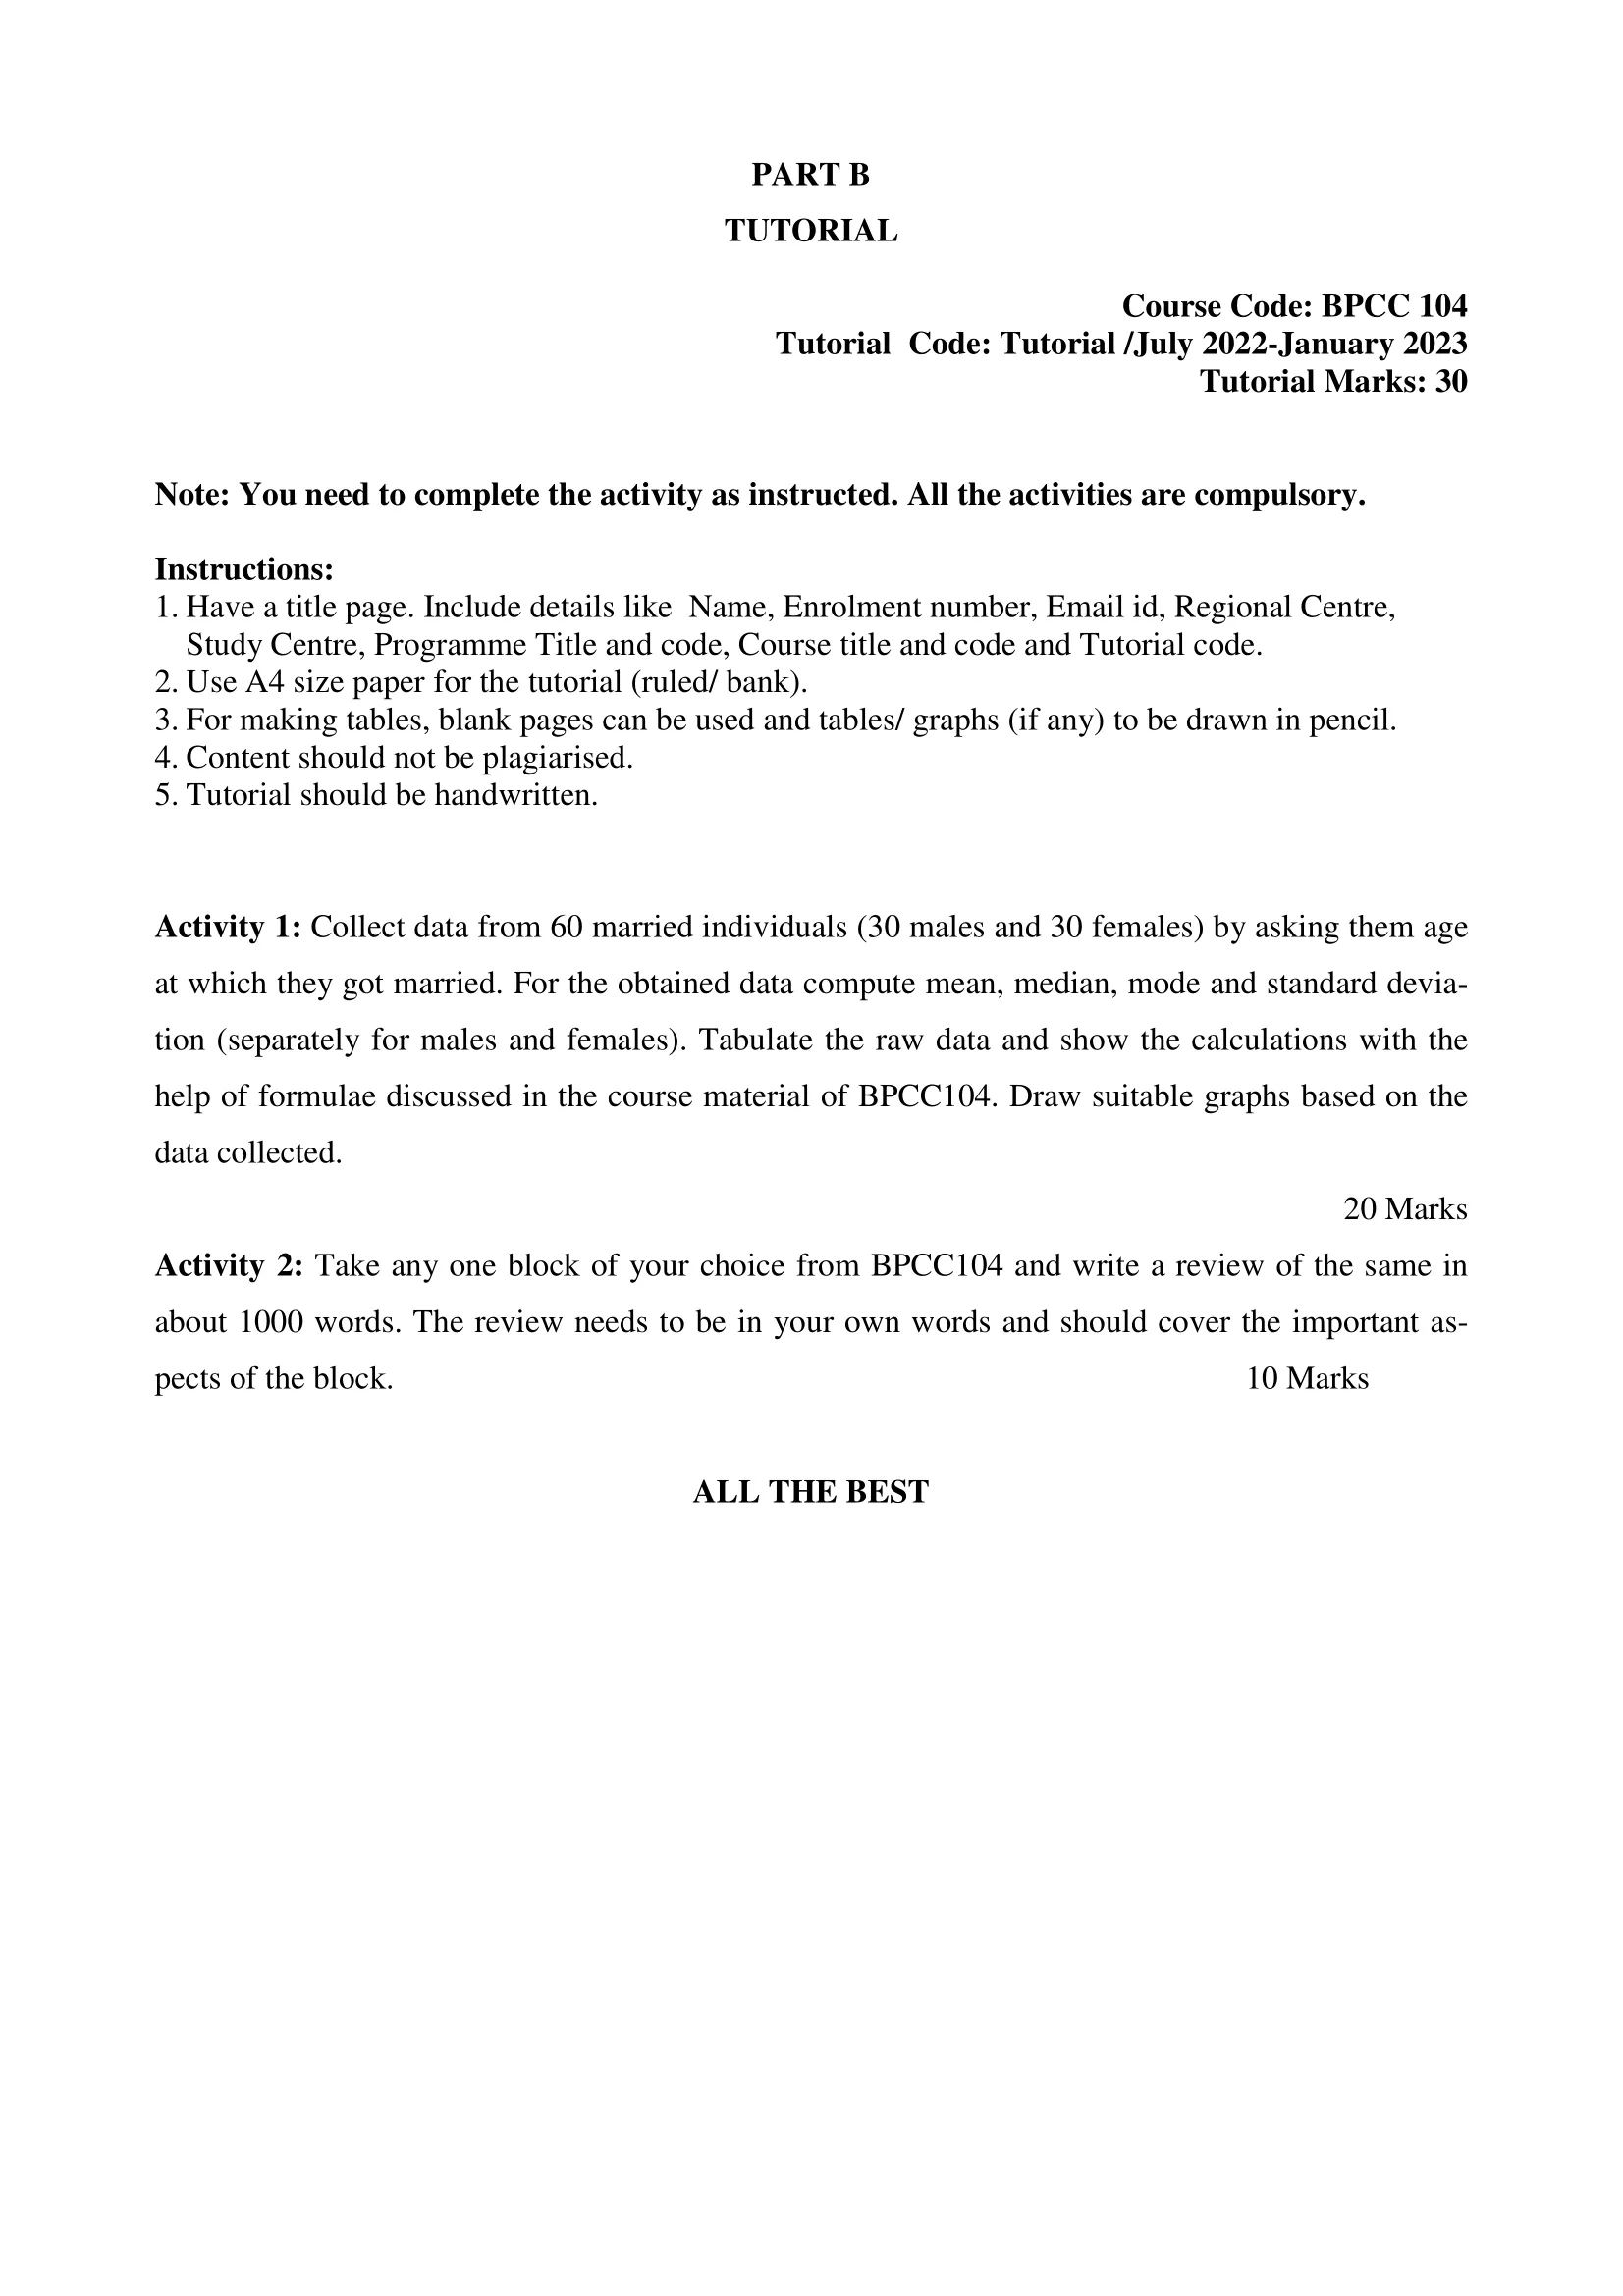
PART B-TUTORIAL
Activity 1: Collect data from 60 married individuals (30 males and 30 females) by asking them age
at which they got married. For the obtained data compute mean, median, mode and standard deviation (separately for males and females). Tabulate the raw data and show the calculations with the help of formulae discussed in the course material of BPCC104. Draw suitable graphs based on the
data collected.
Ans: Raw data collected:
Males: 27, 28, 25, 26, 30, 32, 24, 23, 27, 29, 31, 28, 33, 26, 25, 28, 30, 29, 27, 28, 26, 24, 25, 27, 26, 30, 28, 27, 26, 29
Females: 23, 22, 26, 28, 27, 25, 24, 29, 23, 27, 30, 26, 28, 24, 26, 25, 28, 27, 26, 24, 29, 23, 25, 26, 27, 28, 29, 24, 26, 30
Calculations for Males: Mean: Sum of values = 798 Mean = 798/30 = 26.6
Median: Arranging the values in ascending order, we get: 23, 24, 24, 25, 25, 26, 26, 26, 26, 27, 27, 27, 27, 28, 28, 28, 28, 29, 29, 30, 30, 31, 32, 33 There are 30 observations, so the median is the average of the 15th and 16th observations: (27+27)/2 = 27
Mode: The mode is the value that occurs most frequently. In this case, there is no single value that occurs more than once, so there is no mode.
Standard Deviation: We first need to calculate the variance. Sum of squared deviations from the mean = (27-26.6)^2 + (28-26.6)^2 + … + (29-26.6)^2 = 122.4 Variance = 122.4/29 = 4.2138 Standard deviation = sqrt(variance) = 2.0528
Calculations for Females: Mean: Sum of values = 794 Mean = 794/30 = 26.47
Median: Arranging the values in ascending order, we get: 22, 23, 23, 24, 24, 24, 25, 25, 26, 26, 26, 26, 26, 27, 27, 27, 28, 28, 28, 29, 29, 30, 30 There are 30 observations, so the median is the average of the 15th and 16th observations: (27+27)/2 = 27
Mode: The mode is the value that occurs most frequently. In this case, there is no single value that occurs more than once, so there is no mode.
Standard Deviation: We first need to calculate the variance. Sum of squared deviations from the mean = (23-26.47)^2 + (22-26.47)^2 + … + (30-26.47)^2 = 324.5 Variance = 324.5/29 = 11.17 Standard deviation = sqrt(variance) = 3.341
Tabulated Data:
| Male | Female |
|---|---|
| 27 | 23 |
| 28 | 22 |
| 25 | 26 |
| 26 | 28 |
| 30 | 27 |
Activity 2: Take any one block of your choice from BPCC104 and write a review of the same in about 1000 words. The review needs to be in your own words and should cover the important aspects of the block.
Ans: I have selected Block 3 of BPCC104, which covers the topic of Measures of Central Tendency. The block is divided into four sections, each covering a different measure of central tendency – the arithmetic mean, the median, the mode, and the geometric mean.
The first section of the block covers the arithmetic mean, which is one of the most commonly used measures of central tendency. The block explains that the arithmetic mean is calculated by adding up all the values in a dataset and dividing by the total number of values. The block also explains the properties of the mean, such as its sensitivity to outliers and the fact that it can be affected by changes in the dataset.
The second section of the block covers the median, which is another commonly used measure of central tendency. The block explains that the median is the value that is in the middle of a dataset when the values are arranged in order. The block also explains the properties of the median, such as its insensitivity to outliers and the fact that it can be used to describe datasets that are not normally distributed.
The third section of the block covers the mode, which is the value that occurs most frequently in a dataset. The block explains that the mode is particularly useful for describing datasets that have a bimodal or multimodal distribution, where there are multiple peaks or modes. The block also explains that the mode can be used in conjunction with other measures of central tendency to gain a more complete understanding of a dataset.
The fourth and final section of the block covers the geometric mean, which is a measure of central tendency that is particularly useful for datasets that have a multiplicative structure. The block explains that the geometric mean is calculated by taking the nth root of the product of n values. The block also explains the properties of the geometric mean, such as its sensitivity to changes in the dataset and the fact that it is always less than or equal to the arithmetic mean.
Overall, I found Block 3 of BPCC104 to be a clear and concise introduction to measures of central tendency. The block explains each measure in detail, including its properties, strengths, and weaknesses. The block also includes examples and practice problems to help reinforce the concepts covered. I particularly appreciated the use of real-world examples to illustrate the concepts, as it helped to make the material more relatable and understandable.
One potential area for improvement would be to include more information on when to use each measure of central tendency. While the block does touch on this topic, I think more guidance on choosing the appropriate measure for a given dataset would be helpful. Additionally, while the block includes some practice problems, I think it would be useful to include more interactive elements, such as quizzes or interactive graphs, to help learners engage with the material more actively.
How to Download BPCC-104 Solved Assignment?
You can download it from the www.edukar.in, they have a big database for all the IGNOU solved assignments.
Is the BPCC-104 Solved Assignment Free?
Yes this is absolutely free to download the solved assignment from www.edukar.in
What is the last submission date for BPCC-104 Solved Assignment?
For June Examination: 31st April, For December Examination: 30th October


")


")

")