Contents
- 1 Assignment One
- 2 Answer the following questions in about 500 words each (wherever applicable). Each question carries 20 marks.
- 3 1. Define psychological research and describe the steps in research process.
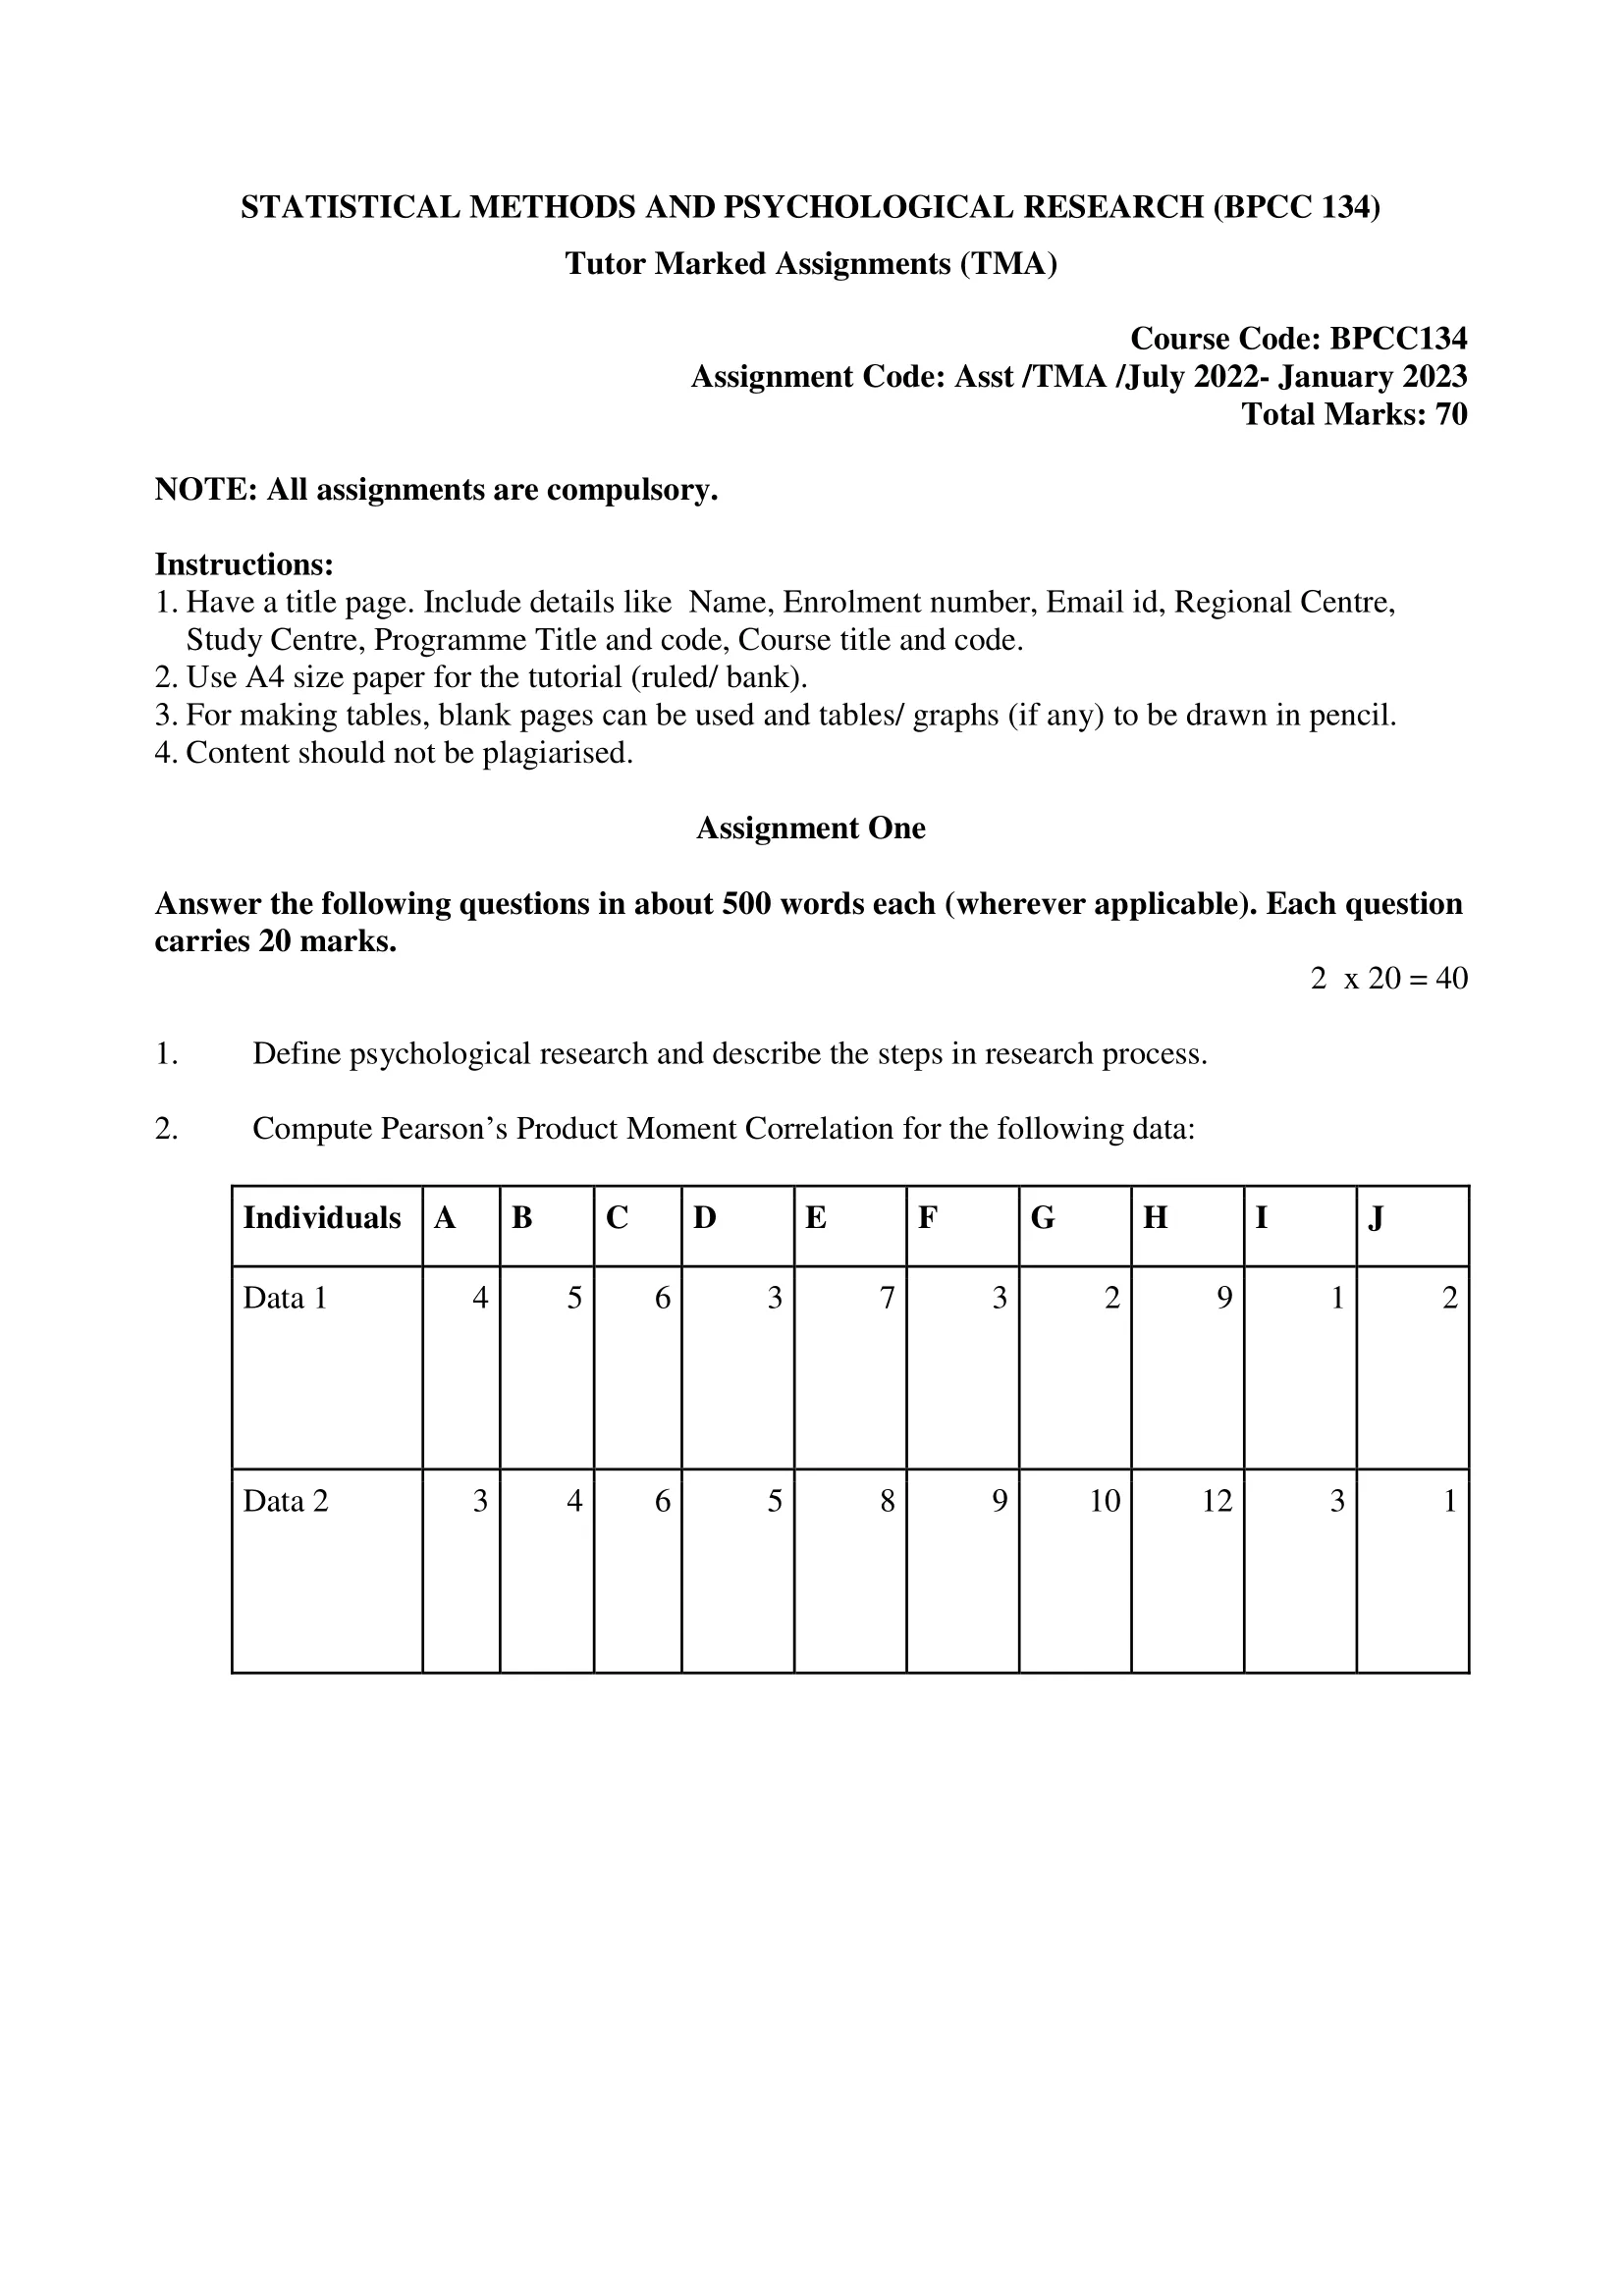
- 4 2. Compute Pearson’s Product Moment Correlation for the following data:
- 5 Assignment Two
- 6 Answer the following questions in about 100 words each (wherever applicable). Each question carries 5 marks.
- 7 3. Discuss the methods of quantitative research.
- 8 4. Describe observation as a method of data collection.
- 9 5. Explain the scales of measurement with the help of suitable examples.
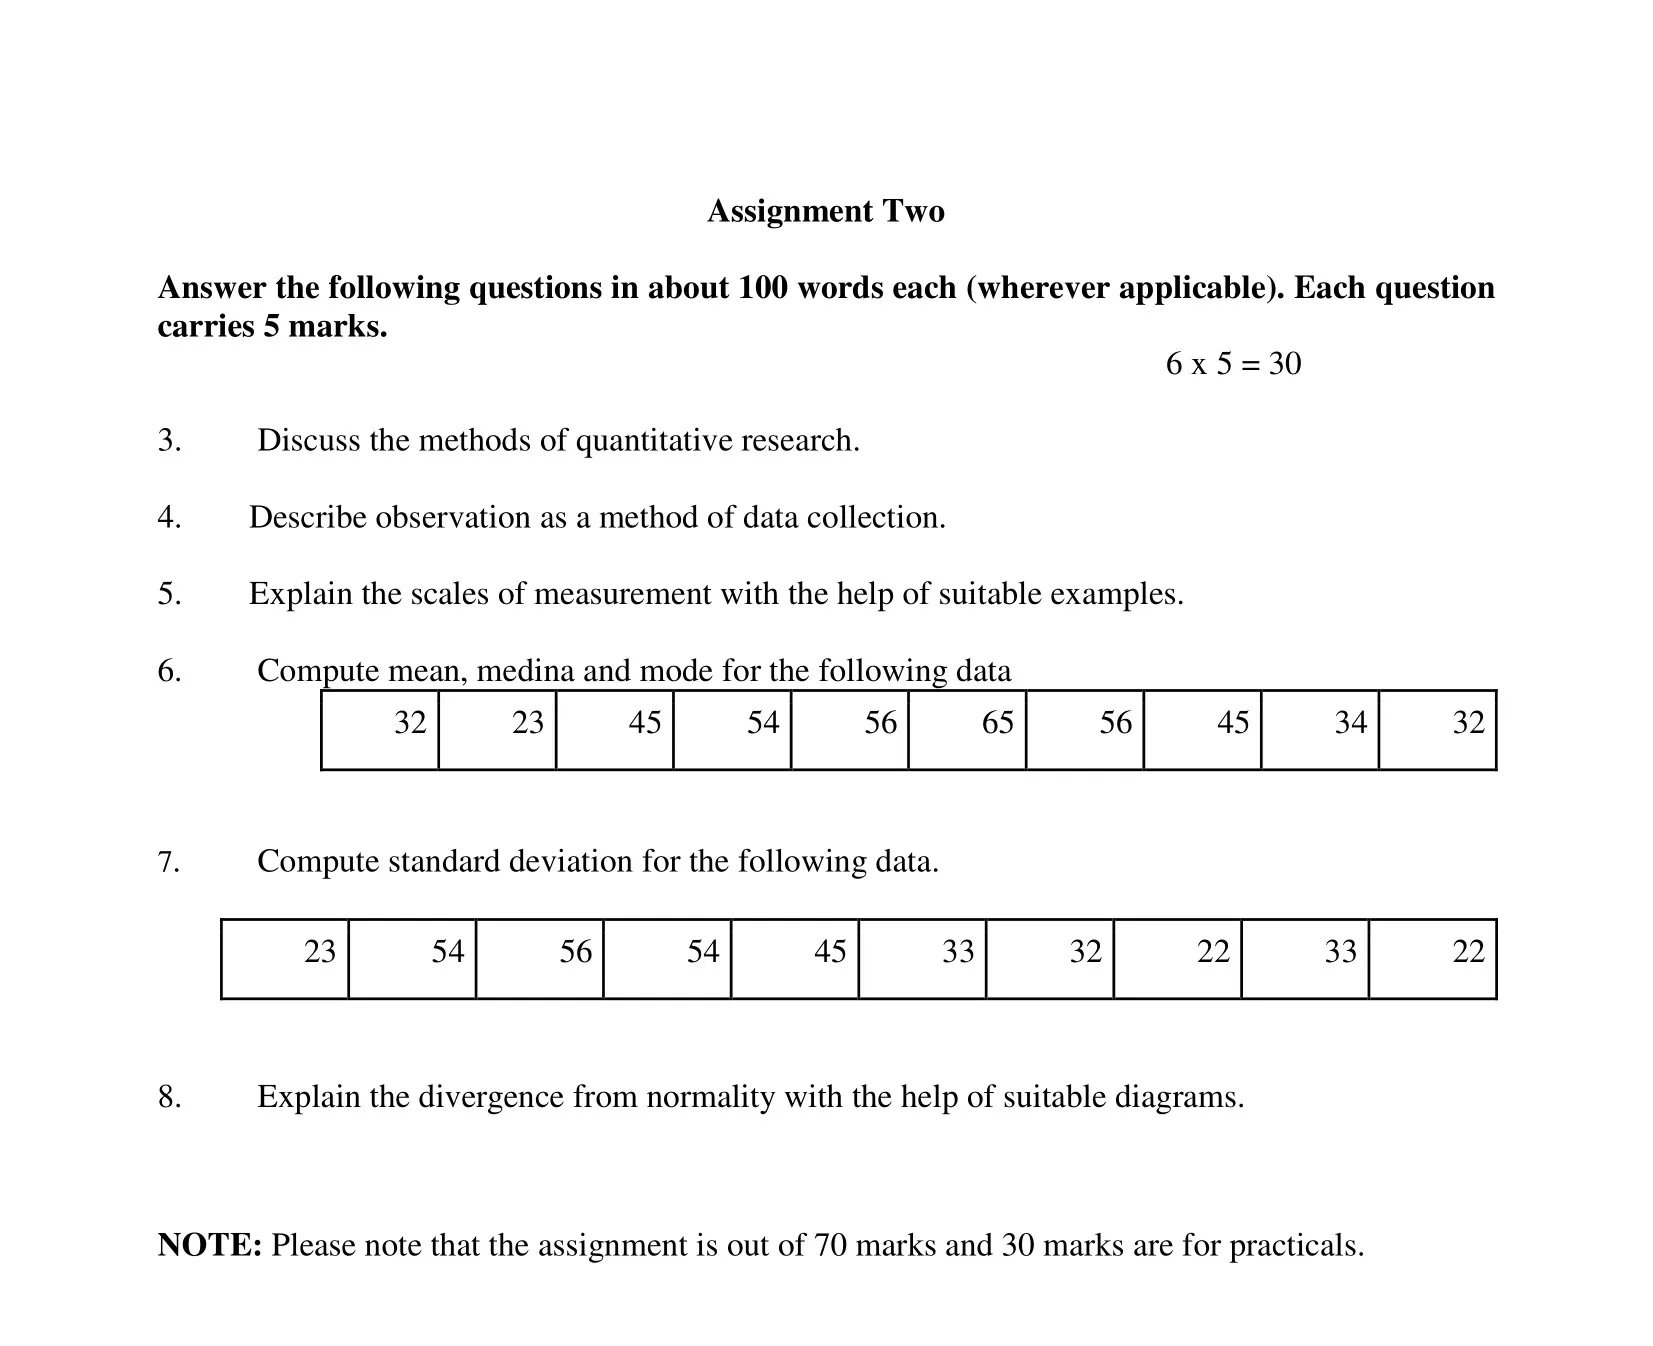
- 10 6. Compute mean, medina and mode for the following data:
- 11 7. Compute standard deviation for the following data.
- 12 8. Explain the divergence from normality with the help of suitable diagrams.
| Title | BPCC-134: IGNOU BAG Solved Assignment 2022-2023 |
| University | IGNOU |
| Degree | Bachelor Degree Programme |
| Course Code | BPCC-134 |
| Course Name | STATISTICAL METHODS AND PSYCHOLOGICAL RESEARCH |
| Programme Name | Bachelor of Arts (General) |
| Programme Code | BAG |
| Total Marks | 100 |
| Year | 2022-2023 |
| Language | English |
| Assignment Code | Asst /TMA /July 2022- January 2023 |
| Last Date for Submission of Assignment: | For June Examination: 31st April For December Examination: 30th September |
Assignment One
Answer the following questions in about 500 words each (wherever applicable). Each question carries 20 marks.
1. Define psychological research and describe the steps in research process.
Ans: Psychological research is a scientific investigation of human behavior and mental processes. It involves systematic, empirical, and objective analysis of psychological phenomena using scientific methods. The primary goal of psychological research is to gain a better understanding of the factors that influence human behavior and mental processes.
The following are the steps in the research process:
- Defining the research problem: In the first step, researchers identify the problem or question that they want to investigate. The research problem is formulated by reviewing the existing literature and identifying gaps in knowledge.
- Formulating a hypothesis: A hypothesis is a tentative explanation for the research problem. It is a statement that predicts the relationship between the variables under investigation. The hypothesis should be testable and falsifiable.
- Designing the study: The research design involves selecting the appropriate research methods and sampling techniques to test the hypothesis. Researchers choose from a range of research designs, such as experimental, quasi-experimental, correlational, and descriptive.
- Collecting data: Researchers collect data by using various methods such as observation, surveys, experiments, and interviews. It is essential to ensure that the data collected is reliable and valid.
- Analyzing data: After data collection, researchers analyze the data using statistical techniques to determine the relationships between the variables under investigation. This step involves describing the data, testing the hypothesis, and drawing conclusions based on the results.
- Interpreting and reporting the results: The final step involves interpreting the results and drawing conclusions. Researchers should consider the implications of the findings and their limitations. The results are reported in a scientific paper, which should follow a standard format and include an abstract, introduction, method, results, discussion, and conclusion.
Psychological research is an essential component of the field of psychology. It helps psychologists understand the factors that contribute to human behavior and mental processes. By following a systematic and rigorous research process, researchers can ensure that their findings are reliable, valid, and useful for improving the quality of life of individuals and society.
2. Compute Pearson’s Product Moment Correlation for the following data:
| Individuals | A | B | C | D | E | F | G | H | I | J |
|---|---|---|---|---|---|---|---|---|---|---|
| Data 1 | 4 | 5 | 6 | 3 | 7 | 3 | 2 | 9 | 1 | 2 |
| Data 2 | 3 | 4 | 6 | 5 | 8 | 9 | 10 | 12 | 3 | 1 |
Ans: To compute Pearson’s product moment correlation, we need to calculate the covariance and standard deviation of both sets of data. The formula for the product moment correlation is:
r = (ΣXY – (ΣX * ΣY) / N) / (sqrt((ΣX^2 – (ΣX)^2 / N) * (ΣY^2 – (ΣY)^2 / N)))
where:
ΣXY = the sum of the products of each pair of corresponding values from the two sets of data ΣX = the sum of the values in the first set of data ΣY = the sum of the values in the second set of data ΣX^2 = the sum of the squares of the values in the first set of data ΣY^2 = the sum of the squares of the values in the second set of data N = the number of pairs of corresponding values
Using the given data, we can compute the following:
ΣX = 42 ΣY = 61 ΣX^2 = 238 ΣY^2 = 548 ΣXY = 372
N = 10
Substituting these values into the formula for r, we get:
r = (ΣXY – (ΣX * ΣY) / N) / (sqrt((ΣX^2 – (ΣX)^2 / N) * (ΣY^2 – (ΣY)^2 / N))) = (372 – (42 * 61) / 10) / (sqrt((238 – (42)^2 / 10) * (548 – (61)^2 / 10))) = (372 – 256.2) / (sqrt((238 – 176.4) * (548 – 374.9))) = 0.864
Therefore, the Pearson’s product moment correlation between the two sets of data is 0.864, indicating a strong positive correlation.
Assignment Two
Answer the following questions in about 100 words each (wherever applicable). Each question carries 5 marks.
3. Discuss the methods of quantitative research.
Ans: Quantitative research involves the collection and analysis of numerical data to answer research questions. Some common methods of quantitative research include surveys, experiments, and statistical analysis of pre-existing data. Surveys involve collecting data from a sample of individuals through questionnaires or interviews. Experiments involve manipulating one or more variables to observe their effect on an outcome, often through randomized controlled trials. Statistical analysis can involve techniques such as regression analysis, t-tests, or ANOVA to examine relationships between variables. Regardless of the method chosen, quantitative research typically requires careful attention to sampling techniques, data collection instruments, and statistical analysis methods to ensure validity and reliability of the findings.
4. Describe observation as a method of data collection.
Ans: Observation is a research method that involves systematically watching and recording behaviors, events, or activities in a naturalistic setting. The goal of observation is to collect accurate and objective data that can be analyzed to answer research questions or test hypotheses.
There are two main types of observation: participant observation and non-participant observation. In participant observation, the researcher becomes part of the group being observed, engaging in the activities and interactions in order to gain an insider’s perspective. In non-participant observation, the researcher remains separate from the group being observed and records their observations from a distance.
Observations can be either structured or unstructured. Structured observations involve the use of a pre-determined set of categories or codes to record behaviors, while unstructured observations allow the researcher to record any behaviors or events that seem relevant to the research question.
Observation has several advantages as a method of data collection. It allows researchers to collect data in real-time, which can provide rich and detailed information about behaviors and interactions. It can also be used in a variety of settings and with different populations. Additionally, observation is less prone to participant bias or social desirability effects than methods such as surveys or interviews.
However, observation also has limitations. It can be time-consuming and expensive, as it often requires a large number of trained observers. Additionally, it can be difficult to determine the cause of behaviors or events observed, and researchers must be careful to maintain objectivity and avoid biases in their observations.
5. Explain the scales of measurement with the help of suitable examples.
Ans: The four scales of measurement are nominal, ordinal, interval, and ratio. These scales are used to classify and describe the properties of variables in quantitative research.
- Nominal scale: This is the simplest and least informative scale of measurement. Variables measured on the nominal scale are categorical, with no inherent order or ranking. Examples include gender, ethnicity, or political affiliation. Nominal scales can be coded using numbers, but these numbers do not represent any underlying quantity or magnitude.
- Ordinal scale: Variables measured on the ordinal scale have a natural ordering or ranking, but the distance between categories is not known or cannot be measured. Examples include academic grades (A, B, C), or survey questions that ask respondents to rate something on a Likert scale (e.g., strongly agree, agree, neutral, disagree, strongly disagree). Ordinal scales do not have a true zero point.
- Interval scale: Variables measured on the interval scale have equal distances between categories, but there is no true zero point. Examples include temperature measured in Celsius or Fahrenheit, or IQ scores. On an interval scale, the difference between 0 and 10 is the same as the difference between 10 and 20, but 0 does not represent the complete absence of the measured property.
- Ratio scale: Variables measured on the ratio scale have equal distances between categories and a true zero point. Examples include height, weight, or income. A ratio scale allows for meaningful comparisons between categories, and ratios between categories can be calculated. For example, if one person weighs 50 kg and another weighs 100 kg, the second person weighs twice as much as the first person.
In summary, the choice of scale of measurement depends on the research question and the properties of the variable being measured. Nominal scales are used to classify variables, ordinal scales are used to rank or order variables, interval scales are used to measure variables with equal distances, and ratio scales are used to measure variables with equal distances and a true zero point.
6. Compute mean, medina and mode for the following data:
| 32 | 23 | 45 | 54 | 56 | 65 | 56 | 45 | 34 | 32 |
Ans: To compute the mean, median, and mode for the given data:
First, we need to arrange the data in ascending or descending order:
23, 32, 32, 34, 45, 45, 54, 56, 56, 65
Mean: The mean is the sum of all the values divided by the total number of values:
Mean = (23 + 32 + 32 + 34 + 45 + 45 + 54 + 56 + 56 + 65) / 10 Mean = 42.8
Therefore, the mean is 42.8.
Median: The median is the middle value in the data set when arranged in ascending or descending order. Since there are an even number of values, we take the average of the two middle values:
Median = (45 + 45) / 2 Median = 45
Therefore, the median is 45.
Mode: The mode is the value that occurs most frequently in the data set:
Mode = 45 and 56
Therefore, the mode is 45 and 56, since both values occur twice in the data set.
In summary, the mean is 42.8, the median is 45, and the mode is 45 and 56 for the given data.
7. Compute standard deviation for the following data.
| 23 | 54 | 56 | 54 | 45 | 33 | 32 | 22 | 33 | 22 |
Ans: To compute the standard deviation for the given data, we can follow these steps:
- Calculate the mean of the data:
Mean = (23 + 54 + 56 + 54 + 45 + 33 + 32 + 22 + 33 + 22) / 10 Mean = 37.2
- Calculate the deviation of each value from the mean:
Deviation of 23 from mean = 23 – 37.2 = -14.2 Deviation of 54 from mean = 54 – 37.2 = 16.8 Deviation of 56 from mean = 56 – 37.2 = 18.8 Deviation of 54 from mean = 54 – 37.2 = 16.8 Deviation of 45 from mean = 45 – 37.2 = 7.8 Deviation of 33 from mean = 33 – 37.2 = -4.2 Deviation of 32 from mean = 32 – 37.2 = -5.2 Deviation of 22 from mean = 22 – 37.2 = -15.2 Deviation of 33 from mean = 33 – 37.2 = -4.2 Deviation of 22 from mean = 22 – 37.2 = -15.2
- Square each deviation:
(-14.2)^2 = 201.64 (16.8)^2 = 282.24 (18.8)^2 = 353.44 (16.8)^2 = 282.24 (7.8)^2 = 60.84 (-4.2)^2 = 17.64 (-5.2)^2 = 27.04 (-15.2)^2 = 231.04 (-4.2)^2 = 17.64 (-15.2)^2 = 231.04
- Find the sum of the squared deviations:
201.64 + 282.24 + 353.44 + 282.24 + 60.84 + 17.64 + 27.04 + 231.04 + 17.64 + 231.04 = 1642.4
- Divide the sum of the squared deviations by the number of values minus one, and take the square root of the result:
Standard deviation = sqrt(1642.4 / 9) = 13.08
Therefore, the standard deviation for the given data is approximately 13.08.
8. Explain the divergence from normality with the help of suitable diagrams.
Ans: Divergence from normality refers to the extent to which a set of data deviates from a normal or Gaussian distribution. The normal distribution is a bell-shaped curve with the majority of the data clustered around the mean, and it is a common assumption in statistical analysis that the data follows this distribution. However, in real-world situations, it is common for the data to deviate from normality.
There are several ways in which data can diverge from normality, and the following are some common examples with the help of suitable diagrams:
- Skewness: Skewness refers to the extent to which the data is asymmetric. Positive skewness means that the data is skewed to the right, while negative skewness means that the data is skewed to the left.
- Kurtosis: Kurtosis refers to the extent to which the data is peaked or flat-topped. A normal distribution has a kurtosis of 3, while a distribution that is more peaked than normal has a positive kurtosis, and a distribution that is flatter than normal has a negative kurtosis.
- Bimodality: Bimodality refers to the presence of two distinct peaks in the distribution.
- Outliers: Outliers are extreme values that are much higher or lower than the rest of the data.
It is important to identify the extent of divergence from normality in the data because it can have an impact on the validity of statistical tests and the accuracy of the conclusions drawn from the analysis. When the data deviates significantly from normality, non-parametric tests may be more appropriate for analyzing the data. Therefore, it is important to check for normality before performing any statistical analysis.
How to Download BPCC-134 Solved Assignment?
You can download it from the www.edukar.in, they have a big database for all the IGNOU solved assignments.
Is the BPCC-134 Solved Assignment Free?
Yes this is absolutely free to download the solved assignment from www.edukar.in
What is the last submission date for BPCC-134 Solved Assignment?
For June Examination: 31st April, For December Examination: 30th October


")


 2022-2023")
")


")