Contents
- 1 Q.1 What is sampling? Discuss the various methods of sampling?
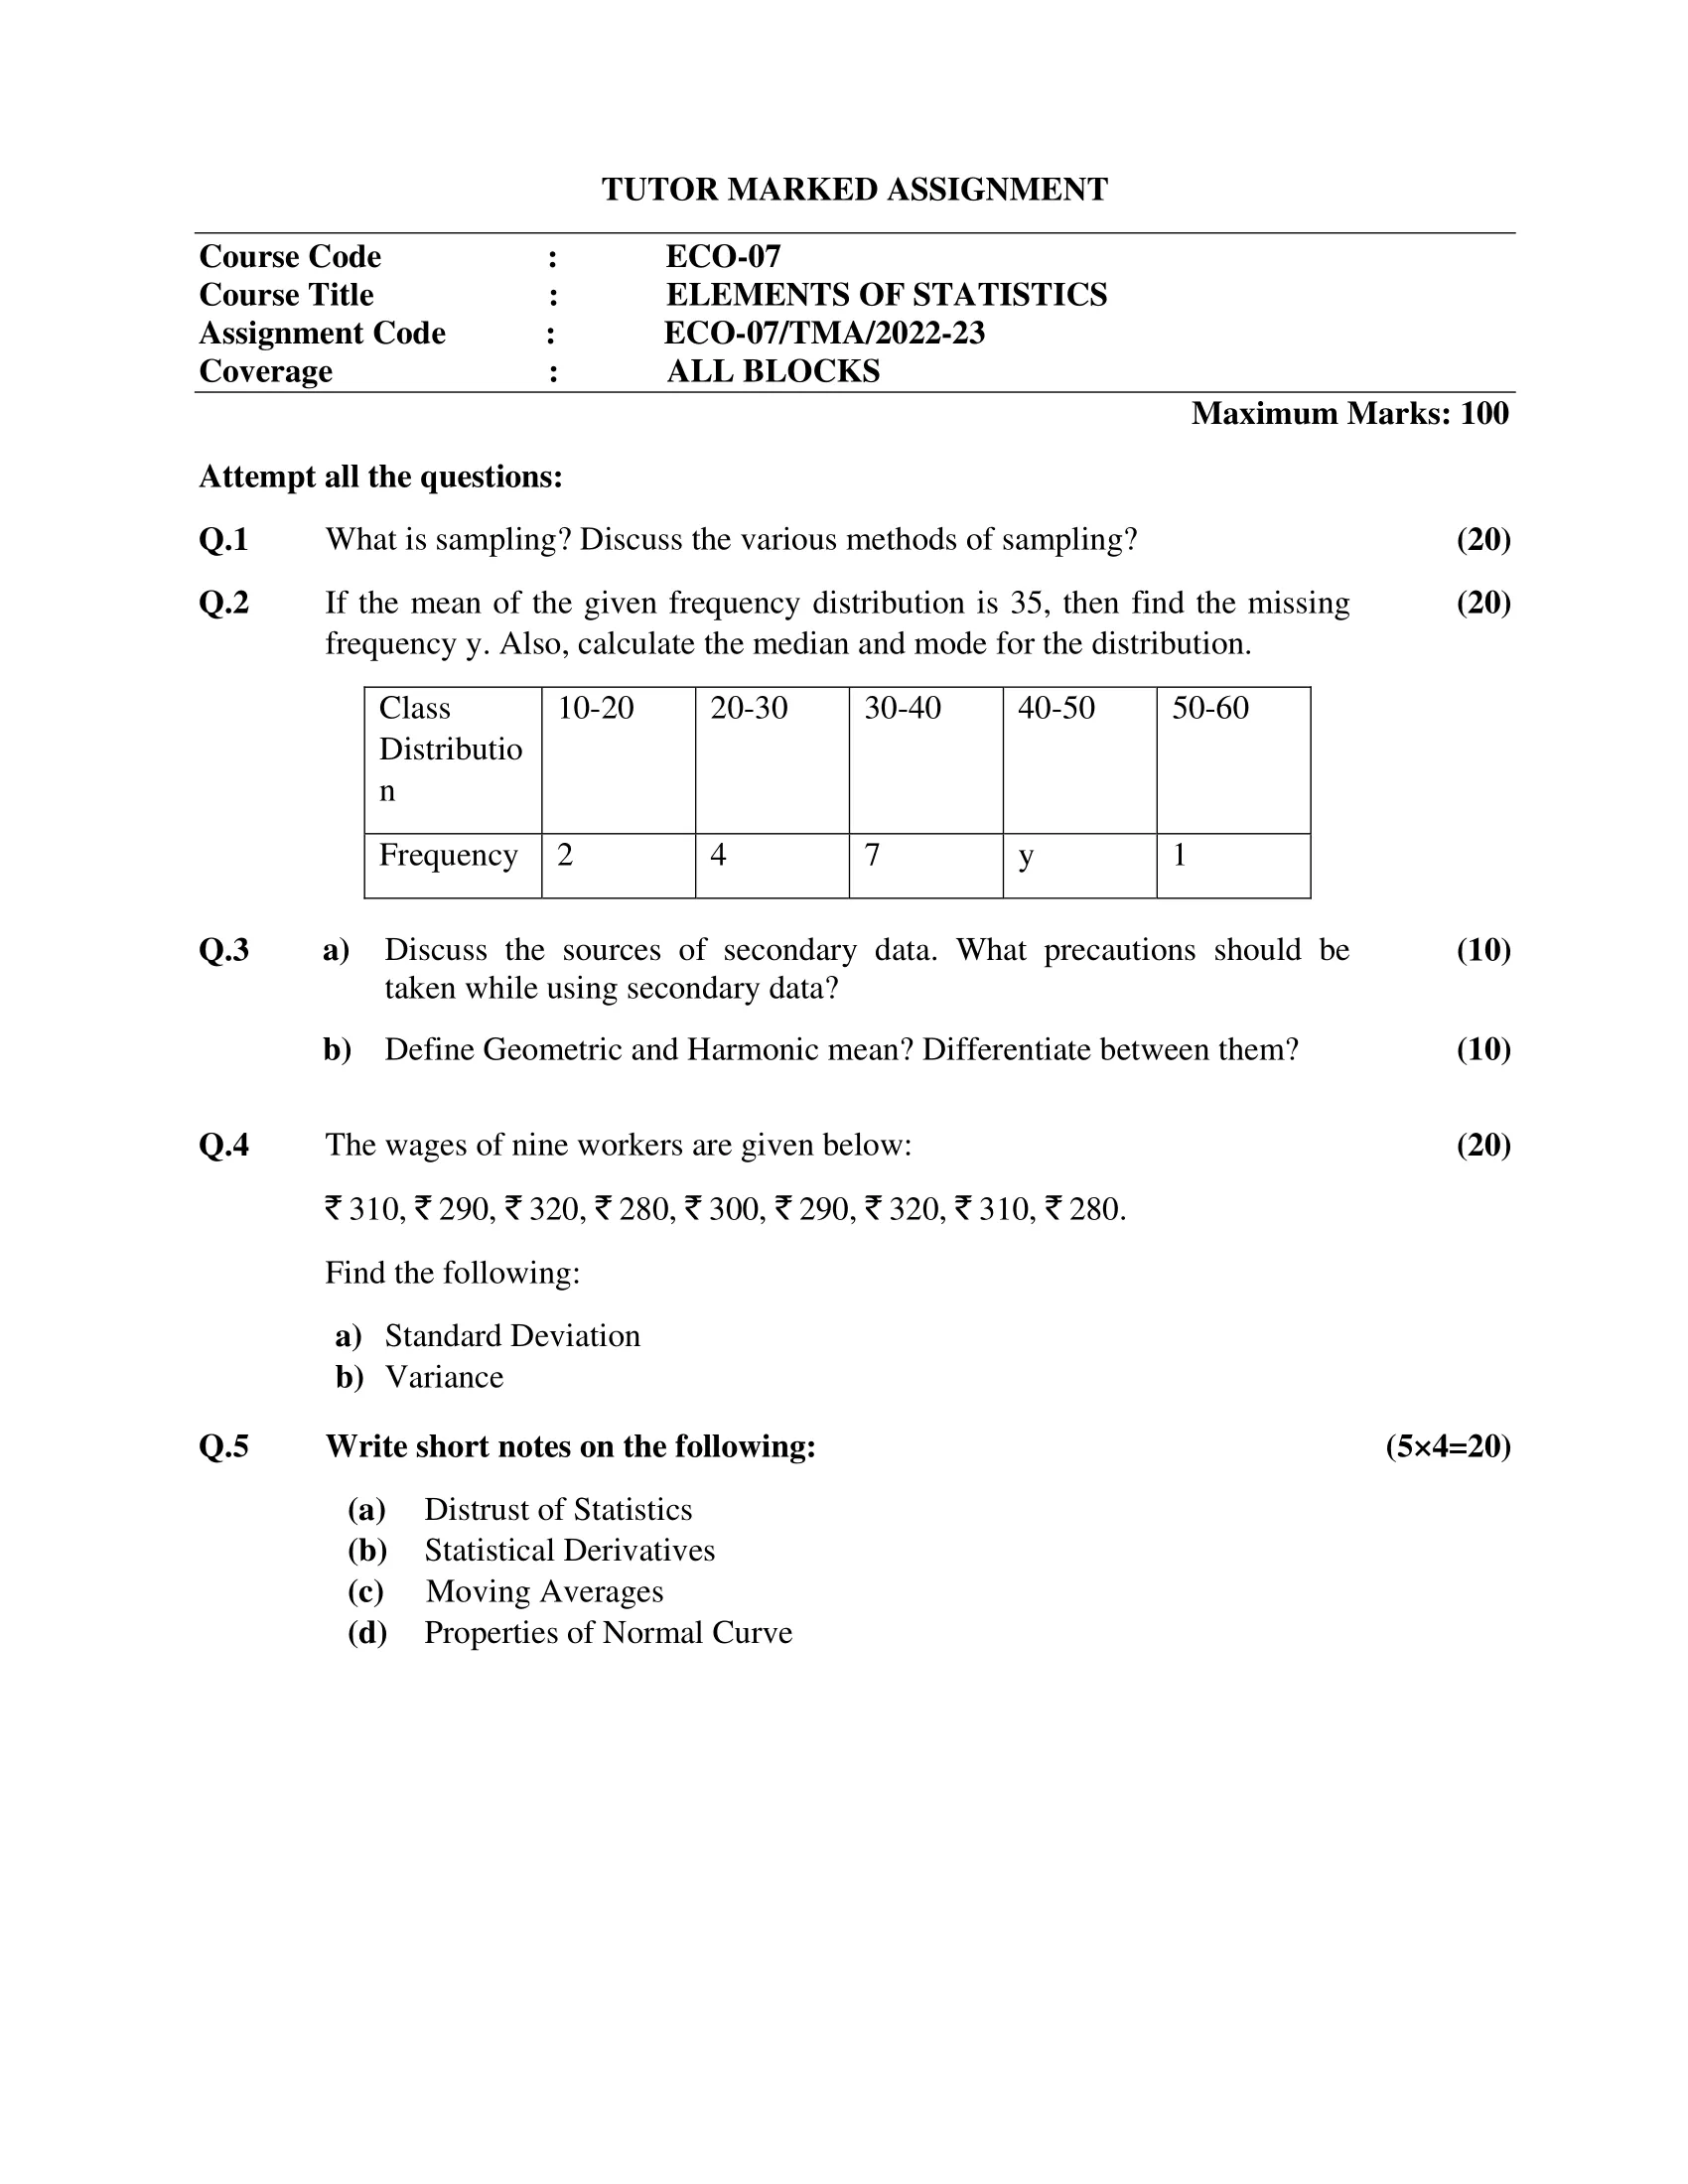
- 2 Q.2 If the mean of the given frequency distribution is 35, then find the missing frequency y. Also, calculate the median and mode for the distribution.
- 3 Q.3 a) Discuss the sources of secondary data. What precautions should be taken while using secondary data?
- 4 b) Define Geometric and Harmonic mean? Differentiate between them?
- 5 Q.4 The wages of nine workers are given below:
- 6 ₹310,₹290, ₹320,₹280, ₹300,₹290, ₹320,₹310, ₹280.
- 7 Find the following:
- 8 a) Standard Deviation
- 9 b) Variance
- 10 Q.5 Write short notes on the following:
- 11 (a) Distrust of Statistics
- 12 (b) Statistical Derivatives
- 13 (c) Moving Averages
- 14 (d) Properties of Normal Curve

| Title | ECO-07: IGNOU B.Com Solved Assignment 2022-2023 |
| University | IGNOU |
| Degree | Bachelor Degree Programme |
| Course Code | ECO-07 |
| Course Name | ELEMENTS OF STATISTICS |
| Programme Name | B.Com |
| Programme Code | BDP |
| Total Marks | 100 |
| Year | 2022-2023 |
| Language | English |
| Assignment Code | ECO-07/TMA/2022-23 |
| Assignment PDF | Click Here |
| Last Date for Submission of Assignment: | For June Examination: 31st April For December Examination: 30th September |
Q.1 What is sampling? Discuss the various methods of sampling?
Ans: Sampling is the process of selecting a subset of individuals or units from a larger population to gather information or data about the population. The goal of sampling is to obtain a representative sample that accurately reflects the characteristics of the larger population.
There are several methods of sampling, each with its own advantages and disadvantages:
- Simple Random Sampling: This is the most basic and widely used method of sampling. Each individual in the population has an equal chance of being selected. This can be done with or without replacement.
- Stratified Sampling: This method involves dividing the population into subgroups or strata based on some relevant characteristic (such as age, gender, income, or education level) and then selecting a random sample from each stratum. This ensures that the sample includes a representative mix of individuals from each group.
- Cluster Sampling: This method involves dividing the population into clusters or groups and then selecting a random sample of clusters. Data is then collected from all individuals within each selected cluster.
- Systematic Sampling: This method involves selecting a random starting point and then selecting every nth individual in the population. This is useful when the population is too large to sample individually.
- Convenience Sampling: This method involves selecting individuals who are convenient or easily accessible. This is the least reliable method of sampling because it can result in a biased sample that does not accurately represent the population.
Each method of sampling has its own strengths and weaknesses, and the choice of method will depend on the research question, the size and characteristics of the population, and the available resources.
Q.2 If the mean of the given frequency distribution is 35, then find the missing frequency y. Also, calculate the median and mode for the distribution.
| Class Distribution | 10-20 | 20-30 | 30-40 | 40-50 | 50-60 |
| Frequency | 2 | 4 | 7 | y | 1 |
Ans: Missing frequency y,
we can use the formula for the mean of a frequency distribution:
mean = (sum of (midpoint x frequency)) / (sum of frequency)
where midpoint is the midpoint of each class interval. We can assume that the class intervals are of equal width, so the midpoint of each interval can be calculated as the average of the upper and lower limits of the interval.
Using this formula and the given information, we have:
35 = [(15 + 20)/2 x 2] + [(20 + 30)/2 x 4] + [(30 + 40)/2 x 7] + [(40 + 50)/2 x y] + [(50 + 60)/2 x 1] / (2 + 4 + 7 + y + 1)
Simplifying, we get:
35 = 17.5 + 50 + 122.5 + 45y + 55 / (14 + y)
Multiplying both sides by the denominator and simplifying, we get:
490 + 35y = 1050 + 45y + 55
Solving for y, we get:
y = 6
Therefore, the missing frequency is 6.
Now , to find the median of the distribution, we need to find the class interval that contains the median. We can do this by adding up the frequencies until we reach the midpoint of the distribution. In this case, the midpoint is (2 + 4 + 7 + 6 + 1) / 2 = 10, since the total frequency is 20.
Starting from the lowest interval, we have:
- The interval 10-20 has a frequency of 2, so the cumulative frequency is 2.
- The interval 20-30 has a frequency of 4, so the cumulative frequency is 6.
- The interval 30-40 has a frequency of 7, so the cumulative frequency is 13.
Therefore, the median falls in the interval 30-40. To find the exact value of the median, we can use the formula:
median = L + ((n/2 – cf) / f) x w
where L is the lower limit of the interval, n is the total frequency, cf is the cumulative frequency up to the interval, f is the frequency of the interval, and w is the width of the interval.
In this case, we have:
L = 30, n = 20, cf = 6, f = 7, w = 10
median = 30 + ((10 – 6.5) / 7) x 10 = 35.71
Therefore, the median of the distribution is 35.71.
Now, the mode of the distribution, we need to look for the class interval with the highest frequency. In this case, the interval with the highest frequency is 30-40, with a frequency of 7. Therefore, the mode of the distribution is 37.50 (the midpoint of the 30-40 interval).
Q.3 a) Discuss the sources of secondary data. What precautions should be taken while using secondary data?
Ans: Secondary data refers to data that has been previously collected by someone else, usually for a different purpose than the one for which it is being used. Secondary data can be obtained from various sources, including:
- Government sources: Governments collect a wide range of data on a variety of topics, including demographics, health, education, and economics. This data can be accessed through various government websites and databases.
- Commercial sources: Market research firms and data brokers collect data on consumer behavior, market trends, and other business-related information. This data can be purchased from these firms.
- Academic sources: Scholarly journals, books, and conference proceedings often contain data that can be used for research purposes.
- Non-profit organizations: Many non-profit organizations collect data on social and environmental issues. This data can be accessed through their websites or by contacting the organizations directly.
While secondary data can be a valuable source of information for research purposes, there are several precautions that should be taken when using it:
- Assess the quality of the data: The accuracy and reliability of the data must be evaluated before using it for research purposes. Researchers should consider factors such as the source of the data, the methodology used to collect it, and any potential biases that may exist.
- Ensure the relevance of the data: Secondary data must be relevant to the research question being investigated. Researchers must carefully examine the data to ensure that it is applicable to their research.
- Check for consistency and completeness: Secondary data should be checked for consistency and completeness to ensure that there are no missing or contradictory data points.
- Consider ethical issues: Researchers must be aware of any ethical issues that may arise when using secondary data, such as issues related to confidentiality, privacy, and data ownership.
- Acknowledge the source of the data: Researchers must acknowledge the source of the secondary data in their research publications to avoid plagiarism and to give credit to the original data collectors.
By taking these precautions, researchers can ensure that they are using high-quality secondary data that is relevant and appropriate for their research purposes.
b) Define Geometric and Harmonic mean? Differentiate between them?
Ans: Both geometric mean and harmonic mean are types of averages used in statistics.
The geometric mean is calculated by multiplying all the numbers in a set and then taking the nth root of the product, where n is the number of values in the set. The formula for the geometric mean of a set of numbers (x1, x2, …, xn) is:
Geometric mean = (x1 * x2 * … * xn)^(1/n)
The geometric mean is useful for calculating growth rates or other factors that are based on multiplicative relationships. For example, if a company’s revenues grew at a rate of 5% per year for three years, the geometric mean can be used to calculate the average annual growth rate over that period.
The harmonic mean, on the other hand, is calculated by taking the reciprocal of each number in a set, calculating the average of the reciprocals, and then taking the reciprocal of the average. The formula for the harmonic mean of a set of numbers (x1, x2, …, xn) is:
Harmonic mean = n / ((1/x1) + (1/x2) + … + (1/xn))
The harmonic mean is useful for calculating rates or averages where the denominator is based on an additive relationship. For example, if a car travels at 60 miles per hour for one hour and then at 30 miles per hour for the next hour, the harmonic mean can be used to calculate the average speed over the entire trip.
The main difference between the two is that the geometric mean uses multiplication to calculate the average, while the harmonic mean uses reciprocals and addition. Additionally, the geometric mean tends to be larger than the harmonic mean, especially when the values in the set are widely dispersed.
Q.4 The wages of nine workers are given below:
₹310,₹290, ₹320,₹280, ₹300,₹290, ₹320,₹310, ₹280.
Find the following:
a) Standard Deviation
Ans: The formula to calculate standard deviation is:
SD = sqrt [ Σ(x – μ)² / N ]
where Σ represents the sum of the values, x is each individual value, μ is the mean, and N is the total number of values.
Using this formula and the given data, we get:
mean (μ) = (₹310 + ₹290 + ₹320 + ₹280 + ₹300 + ₹290 + ₹320 + ₹310 + ₹280) / 9 = ₹300
deviations = (₹310 – ₹300), (₹290 – ₹300), (₹320 – ₹300), (₹280 – ₹300), (₹300 – ₹300), (₹290 – ₹300), (₹320 – ₹300), (₹310 – ₹300), (₹280 – ₹300)
deviations squared = (₹10)², (-₹10)², (₹20)², (-₹20)², (₹0)², (-₹10)², (₹20)², (₹10)², (-₹20)²
sum of squared deviations = Σ(x – μ)² = ₹2000
Substituting these values in the formula for standard deviation, we get:
SD = sqrt [ Σ(x – μ)² / N ] = sqrt (₹2000 / 9) = ₹14.91
b) Variance
Ans: Variance=(Sd)2
=(14.91)2
=222.31
Q.5 Write short notes on the following:
(a) Distrust of Statistics
Ans: Distrust of statistics refers to a skepticism or lack of confidence in the use and interpretation of statistical data. It can arise from various sources, such as misunderstandings or misinterpretations of statistics, concerns about biases or manipulations in data collection or analysis, or a lack of transparency in the presentation of statistical results.
Distrust of statistics can have significant consequences, such as a reluctance to use or trust scientific evidence, or a rejection of policy decisions based on statistical analyses. To address this issue, it is important to improve statistical literacy and transparency in research, as well as to acknowledge and address potential biases or limitations in statistical analyses.
(b) Statistical Derivatives
Ans: Statistical derivatives refer to mathematical tools that are used to measure how one statistical variable changes with respect to another. These tools are often used in statistical analysis to better understand the relationships between different variables and to make predictions about future outcomes.
There are several types of statistical derivatives, including:
- Correlation coefficient: This measures the strength and direction of the linear relationship between two variables. It ranges from -1 to 1, with values closer to -1 indicating a negative correlation and values closer to 1 indicating a positive correlation.
- Regression coefficient: This measures the change in one variable for a unit change in another variable in a linear regression model. It can be used to make predictions about the value of one variable based on the value of another.
- Covariance: This measures how two variables vary together. It is similar to correlation, but it does not adjust for differences in the scale of the variables.
- Partial derivative: This measures the rate of change of a dependent variable with respect to one independent variable, while holding all other variables constant.
- Marginal derivative: This measures the rate of change of a dependent variable with respect to one independent variable, without holding any other variables constant.
Statistical derivatives are powerful tools for analyzing complex data sets and can provide insights into the relationships between different variables. However, they must be used carefully and interpreted in the context of the specific data being analyzed to avoid drawing incorrect conclusions.
(c) Moving Averages
Ans: Moving averages are a statistical tool used in data analysis and time series forecasting. They provide a smoothed representation of the data by removing short-term fluctuations and highlighting long-term trends.
A moving average is calculated by taking the average of a subset of consecutive data points over a specified window of time. The window size can be fixed or vary over time, depending on the application.
There are two common types of moving averages:
- Simple Moving Average (SMA): This is calculated by taking the average of a fixed number of data points over a specific time period. For example, a 20-day simple moving average would be calculated by taking the average of the last 20 days of data.
- Exponential Moving Average (EMA): This is similar to the SMA, but it assigns a greater weight to more recent data points. The weighting factor decreases exponentially over time, giving more weight to recent data and less weight to older data.
Moving averages are useful for smoothing out noise and identifying trends in the data. They can also be used to generate trading signals in financial markets, where traders often use moving averages to identify potential buy or sell opportunities based on the crossover of short-term and long-term moving averages.
However, moving averages have limitations and can be sensitive to changes in the data or the choice of window size. Therefore, it is important to use moving averages in conjunction with other statistical tools and to carefully consider the appropriate window size and weighting factors for the specific application.
(d) Properties of Normal Curve
Ans: The normal curve, also known as the Gaussian distribution, is a probability distribution that is often used in statistical analysis. It has several properties that make it a useful tool for modeling data in many different fields. Some of the key properties of the normal curve include:
- Symmetry: The normal curve is symmetric, meaning that it is the same shape on both sides of its peak. This makes it useful for modeling data that is evenly distributed around a central value.
- Bell-shaped: The normal curve is bell-shaped, meaning that it has a single peak in the middle and tapers off on either side. This shape is useful for modeling data that is distributed around a mean value with a predictable degree of variation.
- Mean and standard deviation: The normal curve is fully characterized by its mean and standard deviation. The mean represents the central value of the distribution, while the standard deviation represents the degree of variation around the mean.
- Inflection points: The normal curve has two points of inflection, where it changes from curving upward to curving downward, and vice versa. These points are equidistant from the mean and mark the points where the curve’s curvature is greatest.
- Empirical rule: The normal curve follows the empirical rule, which states that approximately 68% of the data falls within one standard deviation of the mean, 95% of the data falls within two standard deviations of the mean, and 99.7% of the data falls within three standard deviations of the mean.
The properties of the normal curve make it a useful tool for modeling and analyzing data in a variety of fields, including finance, biology, and psychology. It is often used to test hypotheses and make predictions about the behavior of complex systems.
How to Download ECO-07 Solved Assignment?
You can download it from the www.edukar.in, they have a big database for all the IGNOU solved assignments.
Is the ECO-072 Solved Assignment Free?
Yes this is absolutely free to download the solved assignment from www.edukar.in
What is the last submission date for ECO-07 Solved Assignment?
For June Examination: 31st April, For December Examination: 30th October