| Title | BECC-111: IGNOU BAG Solved Assignment 2022-2023 |
| University | IGNOU |
| Degree | Bachelor Degree Programme |
| Course Code | BECC-111 |
| Course Name | INDIAN ECONOMY-I |
| Programme Name | Bachelor of Arts (General) |
| Programme Code | BAG |
| Total Marks | 100 |
| Year | 2022-2023 |
| Language | English |
| Assignment Code | BECC-111/AST/TMA/2022-23 |
| Last Date for Submission of Assignment: | For June Examination: 31st April For December Examination: 30th September |

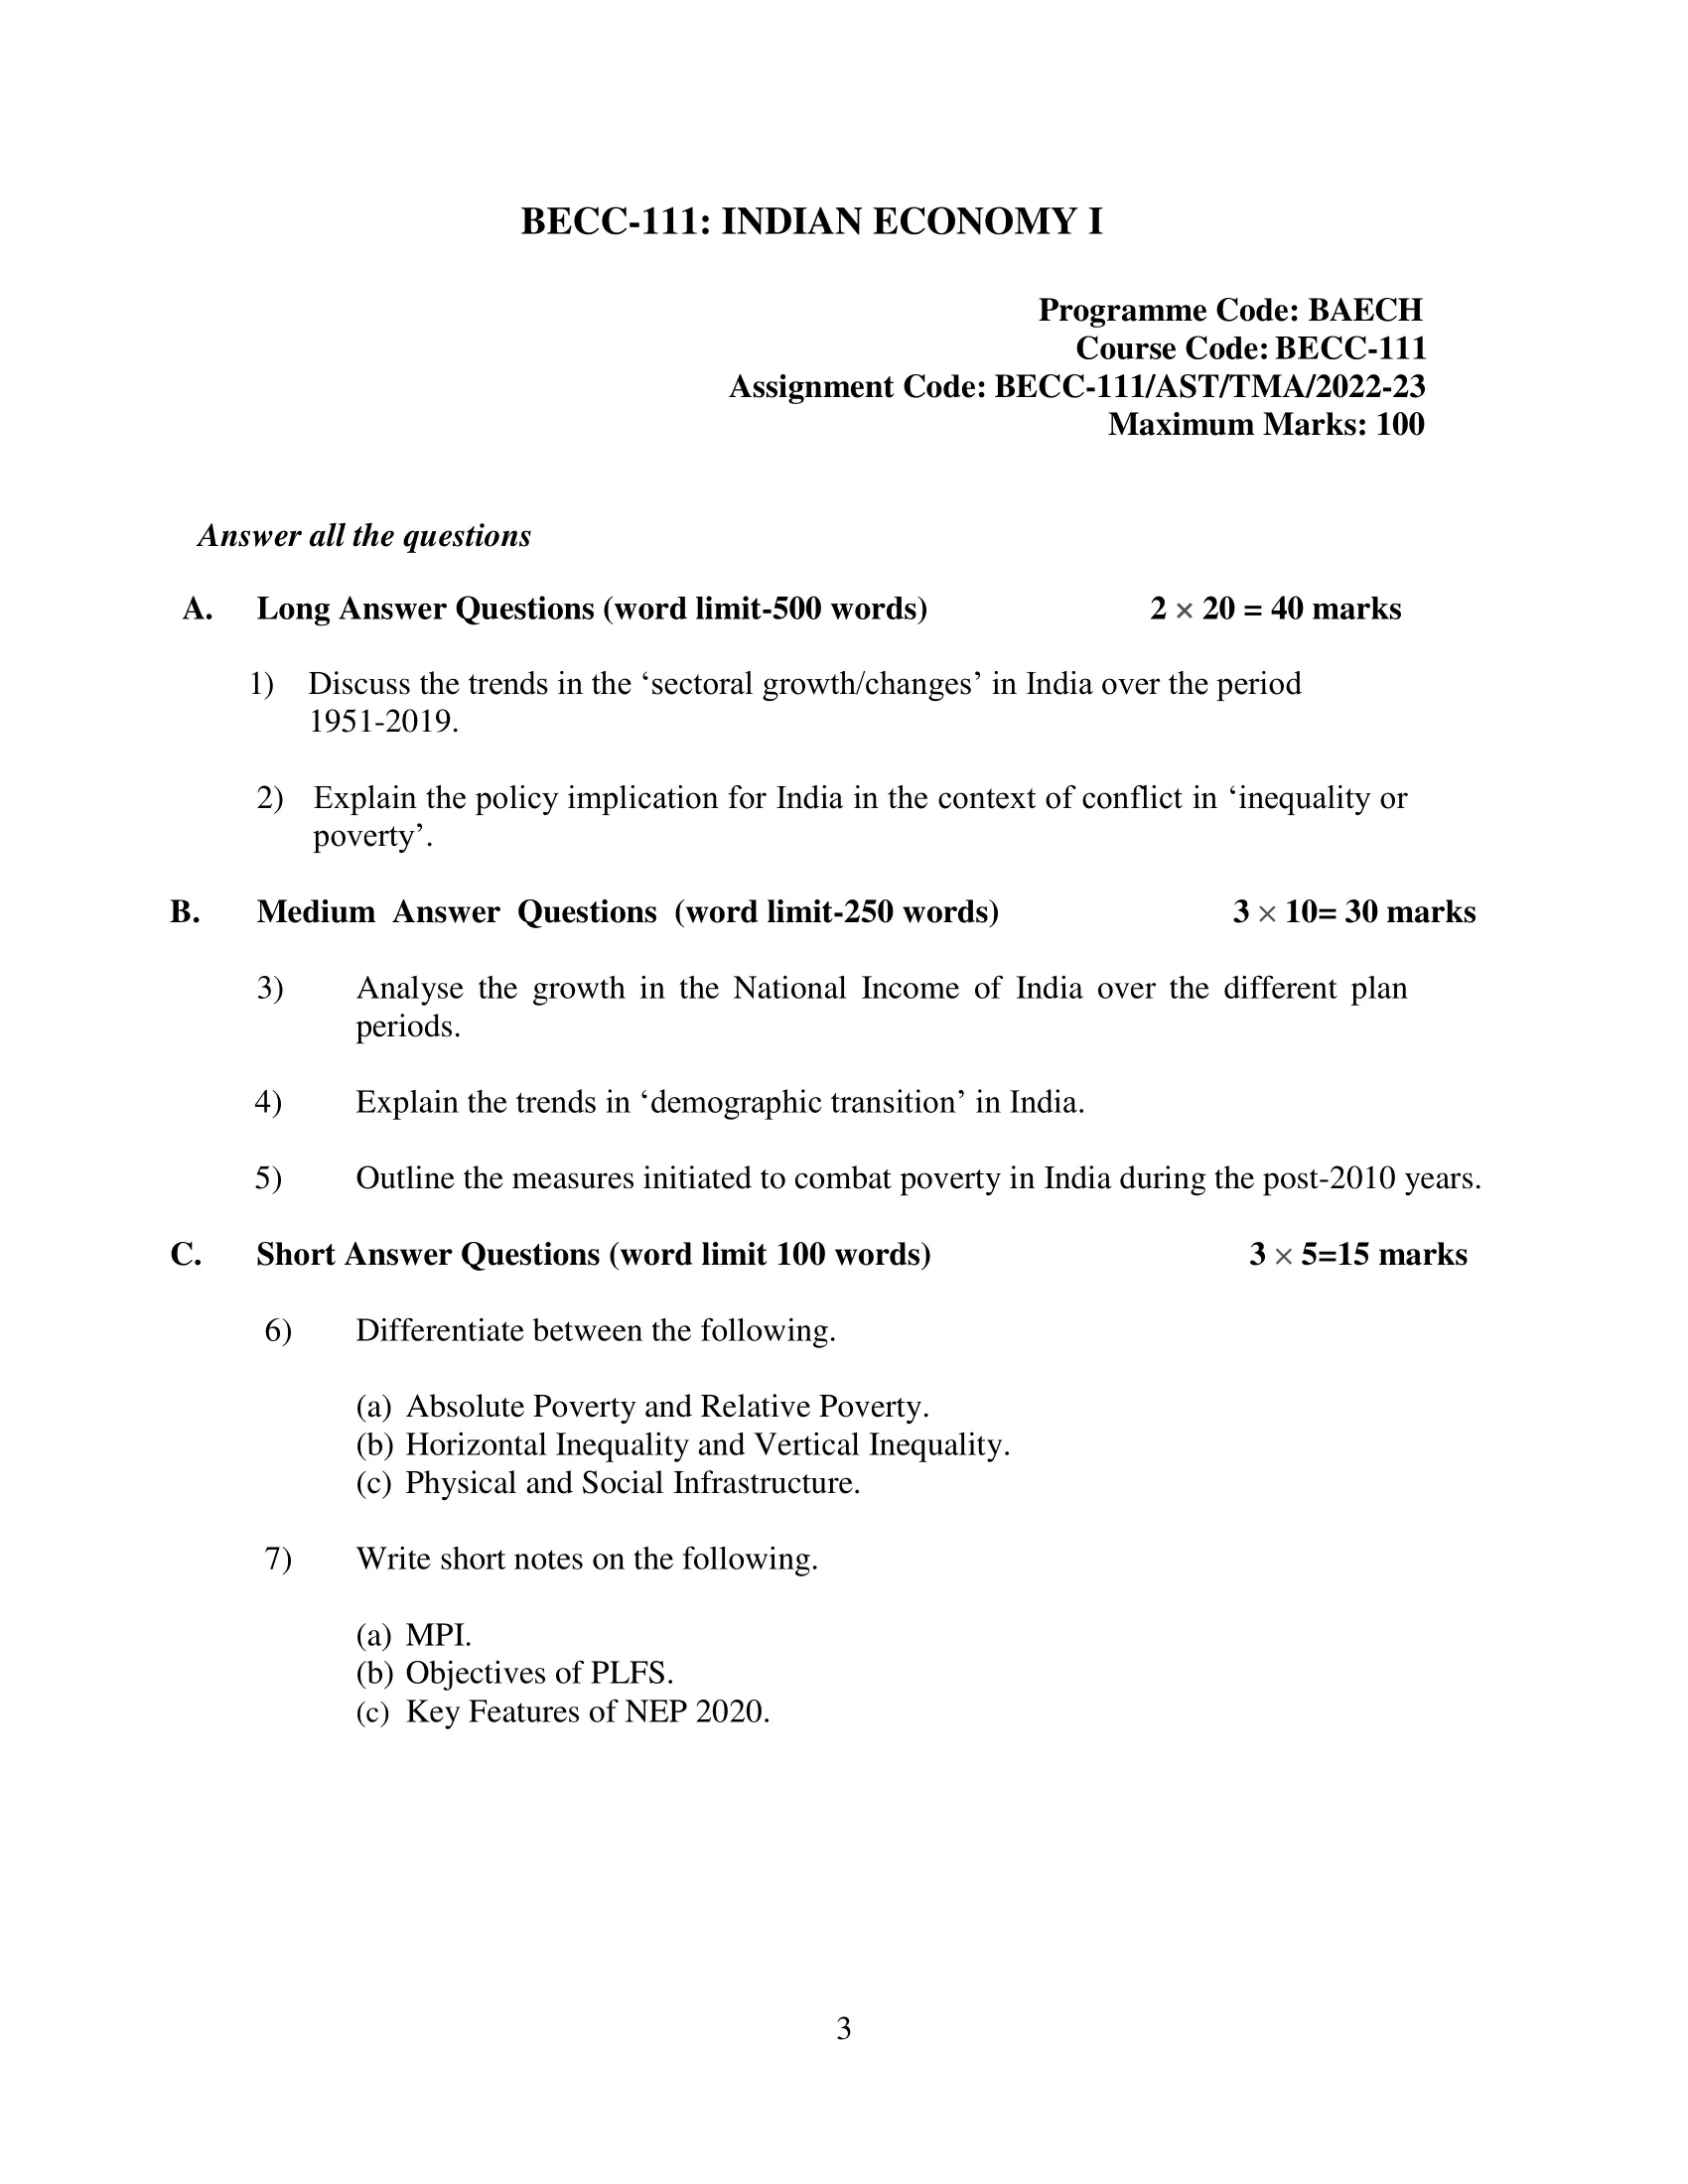
A. Long Answer Questions (word limit-500 words)
1) Discuss the trends in the ‘sectoral growth/changes’ in India over the period 1951-2019.
Ans: India has witnessed significant changes in sectoral growth over the past seven decades, particularly since its independence in 1947. From a predominantly agricultural economy, India has transformed into a diversified economy with a growing services sector. Here are the key trends in the sectoral growth of India between 1951 and 2019:
- Agriculture: In 1951, agriculture accounted for around 55% of India’s GDP, and it remained the most important sector until the 1980s. However, with the Green Revolution and increased focus on industry and services, the contribution of agriculture to GDP has declined to around 17% in 2019. Despite this, agriculture remains a significant source of employment in India.
- Industry: The share of industry in GDP has increased from around 15% in 1951 to around 30% in 2019. The growth of the manufacturing sector has been particularly significant in recent years, with the government’s ‘Make in India’ campaign aiming to boost the manufacturing sector’s share in the economy.
- Services: The services sector has witnessed exponential growth in recent years, with its share in GDP increasing from around 30% in 1951 to around 53% in 2019. This growth can be attributed to the expansion of the IT and IT-enabled services sector, as well as the growth of the financial and professional services sector.
- Trade: Trade has played a significant role in India’s economic growth, with the country’s exports and imports increasing significantly over the past few decades. The share of exports in GDP has increased from around 4% in 1951 to around 19% in 2019.
- Infrastructure: India’s infrastructure sector has seen significant growth over the past few decades, particularly in recent years. The government has undertaken several initiatives to improve infrastructure, such as the construction of new airports, seaports, highways, and railways.
- Human Development: India has made significant strides in human development over the past few decades, with improvements in healthcare, education, and overall standard of living. This has contributed to the growth of several sectors such as healthcare, education, and tourism.
2) Explain the policy implication for India in the context of conflict in ‘inequality or poverty’.
Ans: Inequality and poverty are critical issues that India has been grappling with for several decades. While poverty alleviation has been a key policy priority for successive governments, the problem of inequality has received increasing attention in recent years. Here are some policy implications for India in the context of the conflict between inequality and poverty:
- Redistribution policies: One way to address the conflict between inequality and poverty is to implement redistribution policies that aim to redistribute wealth from the rich to the poor. This could include policies such as progressive taxation, cash transfers, and subsidies for essential goods and services. The government could also invest in social welfare programs such as healthcare, education, and affordable housing to help lift people out of poverty.
- Inclusive growth: The government could focus on inclusive growth, which aims to ensure that the benefits of economic growth are distributed more equitably. This could include policies that promote job creation and entrepreneurship, particularly in sectors that are labor-intensive and have a high potential for growth. The government could also promote the development of small and medium-sized enterprises, which are critical for creating jobs and reducing poverty.
- Education and skill development: Education and skill development are critical for addressing both inequality and poverty. The government could invest in education and skill development programs to ensure that people have the skills and knowledge needed to compete in the job market. This could include programs that target marginalized communities, such as women and minorities, who are often the most vulnerable to poverty and inequality.
- Strengthening social safety nets: The government could strengthen social safety nets to provide a basic level of protection for the poor and vulnerable. This could include programs such as food subsidies, healthcare, and unemployment benefits, which can help people cope with unexpected shocks and emergencies.
- Addressing corruption and inefficiencies: Corruption and inefficiencies in the delivery of public services can exacerbate inequality and poverty. The government could take steps to address corruption and improve the efficiency of service delivery, which can help ensure that public resources are used effectively and benefit the poor and vulnerable.
B. Medium Answer Questions (word limit-250 words)
3) Analyse the growth in the National Income of India over the different plan periods.
Ans: India’s national income, measured as Gross Domestic Product (GDP), has grown significantly since independence in 1947. The Indian government adopted a series of five-year plans beginning in 1951 to promote economic development and growth, each with specific targets and objectives.
During the first two plan periods (1951-56 and 1956-61), India focused on developing its agriculture and industrial sectors. The annual average growth rate of GDP during this period was around 3.6%.
The third plan period (1961-66) saw a shift towards heavy industries and the expansion of the public sector. This led to an average annual GDP growth rate of 4.3%.
The fourth plan period (1969-74) focused on self-reliance and the development of basic industries, resulting in an average annual GDP growth rate of 3.3%.
The fifth plan period (1974-79) emphasized poverty reduction and rural development, leading to an average annual GDP growth rate of 4.8%.
The sixth plan period (1980-85) aimed to promote balanced regional development and increase employment opportunities, resulting in an average annual GDP growth rate of 5.7%.
During the seventh plan period (1985-90), India focused on promoting social justice and equity while also liberalizing its economy. The average annual GDP growth rate during this period was around 6%.
The eighth plan period (1992-97) saw further economic liberalization and reforms, resulting in an average annual GDP growth rate of 6.8%.
The ninth plan period (1997-2002) continued to focus on economic liberalization and also emphasized human development. The average annual GDP growth rate during this period was around 5.5%.
The tenth plan period (2002-07) aimed to achieve an annual GDP growth rate of 8%, which was successfully achieved with an average annual growth rate of 7.7%.
The eleventh plan period (2007-12) emphasized inclusive growth and social development, with an average annual GDP growth rate of around 7.9%.
Finally, the twelfth plan period (2012-17) focused on sustainable and inclusive growth, resulting in an average annual GDP growth rate of around 7.5%.
4) Explain the trends in ‘demographic transition’ in India.
Ans: Demographic transition refers to the changes in population dynamics that occur as a country moves from a state of high birth and death rates to a state of low birth and death rates. India has undergone significant demographic changes over the past century, with a decline in death rates followed by a decline in birth rates.
In the first stage of demographic transition, both birth and death rates are high, resulting in slow population growth. This was the situation in India before the mid-20th century, with high infant and child mortality rates and short life expectancies.
The second stage of demographic transition is characterized by a decline in death rates, while birth rates remain high. This results in rapid population growth. India began to experience this transition in the 1950s, with the implementation of public health measures such as vaccination programs and improved sanitation. As a result, life expectancies increased, and the population grew rapidly.
The third stage of demographic transition is characterized by a decline in birth rates, leading to a decrease in population growth. India entered this stage in the 1980s, as family planning programs were introduced and became more widely available. These programs promoted the use of contraception and education on reproductive health, resulting in a decline in fertility rates.
Currently, India is in the fourth stage of demographic transition, where both birth and death rates are low, resulting in slow population growth. However, the population is still growing due to a high base population. The declining birth rates have led to changes in the age structure of the population, with a larger proportion of the population in the working-age group.
5) Outline the measures initiated to combat poverty in India during the post-2010 years.
Ans: India has made significant efforts to combat poverty in the post-2010 years. Some of the measures initiated to address poverty include:
- Mahatma Gandhi National Rural Employment Guarantee Act (MGNREGA): This program guarantees 100 days of employment per year to every rural household with adult members willing to do unskilled manual work. The program has been instrumental in reducing poverty and boosting rural incomes.
- Pradhan Mantri Jan Dhan Yojana: This program aims to provide financial inclusion to every household in the country by opening bank accounts for them. This helps in bringing the unbanked population into the formal banking system, thus enabling them to access various government schemes and subsidies.
- Swachh Bharat Abhiyan: This program aims to improve sanitation and cleanliness in rural and urban areas, which is expected to have a positive impact on public health and poverty reduction.
- Pradhan Mantri Ujjwala Yojana: This program provides free LPG connections to households living below the poverty line, which helps in reducing the use of traditional fuels and the associated health hazards.
- National Food Security Act (NFSA): This act provides legal entitlements to foodgrains to around two-thirds of the population, including the poor and vulnerable sections of society.
- Digital India: This program aims to provide digital infrastructure and internet connectivity to all citizens, including those living in rural areas. This can help in reducing information asymmetry and improve access to various government schemes and services.
- Ayushman Bharat: This program provides health insurance to around 50 crore people, covering the costs of hospitalization and critical illnesses. This can help in reducing out-of-pocket expenses on healthcare, which is a major cause of poverty.
C. Short Answer Questions (word limit 100 words)
6) Differentiate between the following.
(a) Absolute Poverty and Relative Poverty.
Ans: Absolute poverty refers to the lack of access to the basic necessities of life, such as food, shelter, and clothing, needed to sustain a person’s life. It is a universal measure of poverty and is based on an absolute minimum income threshold below which people are considered to be living in poverty.
Relative poverty, on the other hand, is a measure of poverty based on a person’s income or standard of living in relation to the rest of society. It is a comparative measure, and people are considered to be living in relative poverty if their income falls below a certain percentage of the median income in their society.
In short, absolute poverty is based on a fixed, objective minimum income threshold, while relative poverty is based on a person’s income or standard of living in relation to others in society.
(b) Horizontal Inequality and Vertical Inequality.
Ans: Horizontal inequality and vertical inequality are two different types of inequalities:
Horizontal inequality refers to inequalities that exist between different social or cultural groups. It can include differences in income, education, health, or access to public services. These inequalities can arise due to factors such as discrimination, historical disadvantage, or cultural differences. For example, in India, there are significant horizontal inequalities between different castes, tribes, and religious groups.
Vertical inequality, on the other hand, refers to the differences in income, wealth, or social status that exist between individuals or households in a society. It is often measured using the Gini coefficient, which is a statistical measure of inequality. Vertical inequality can arise due to differences in education, skills, occupation, or access to opportunities. For example, in many countries, there is significant vertical inequality between the rich and the poor.
In summary, horizontal inequality refers to inequalities between different social or cultural groups, while vertical inequality refers to differences in income, wealth, or social status between individuals or households in a society.
(c) Physical and Social Infrastructure.
Ans: Physical infrastructure refers to the basic physical structures and facilities that are necessary for the functioning of a society or economy, such as transportation networks, communication systems, energy systems, and water supply and sanitation systems. Physical infrastructure is critical for economic growth and development, as it provides the foundation for productive activities and trade.
Social infrastructure, on the other hand, refers to the facilities, structures, and institutions that support human and social development, such as healthcare, education, social welfare, and cultural institutions. Social infrastructure is important for improving human capital and social welfare, as well as promoting social cohesion and inclusivity.
7) Write short notes on the following.
(a) MPI.
Ans: The Multidimensional Poverty Index (MPI) is a measure of poverty that takes into account multiple dimensions of deprivation. It was developed by the United Nations Development Programme (UNDP) and the Oxford Poverty and Human Development Initiative (OPHI) and is based on the idea that poverty is more than just a lack of income. The MPI measures poverty in three dimensions: health, education, and standard of living. It identifies people who are deprived in at least one-third of ten weighted indicators, which include things like nutrition, child mortality, school attendance, and access to electricity and clean water. The MPI is used to provide a more comprehensive and accurate picture of poverty than traditional income-based measures, and it is increasingly being used by policymakers and development practitioners to target poverty reduction efforts more effectively.
(b) Objectives of PLFS.
Ans: The Periodic Labour Force Survey (PLFS) is a comprehensive household survey conducted by the National Sample Survey Office (NSSO) in India. The main objectives of the PLFS are:
- To collect data on employment, unemployment, and labour force participation rates in both rural and urban areas.
- To provide estimates of the distribution of employment and unemployment by different socio-economic groups, such as age, sex, education, and social groups.
- To estimate the extent of informal employment and its characteristics.
- To gather information on the nature and characteristics of employment in various sectors of the economy, such as agriculture, manufacturing, and services.
- To provide data on wages and earnings, hours of work, and other aspects of working conditions.
The PLFS is an important source of information for policymakers, researchers, and analysts working on labour market issues in India. The survey is conducted on a regular basis to provide up-to-date and reliable data on the changing nature of employment and the labour market in the country.
(c) Key Features of NEP 2020
Ans: The National Education Policy (NEP) 2020 is a comprehensive policy framework for the development of education in India. The key features of the NEP 2020 are:
- Focus on early childhood care and education (ECCE) and foundational literacy and numeracy.
- Introduction of a 5+3+3+4 structure for school education.
- Introduction of a new curricular and pedagogical framework with a flexible and multidisciplinary approach.
- Emphasis on mother tongue or local language as the medium of instruction up to grade 5.
- Encouragement of experiential learning and critical thinking in the classroom.
- Introduction of a credit-based system for higher education and multiple entry and exit options.
- Setting up of a National Educational Technology Forum (NETF) to promote the use of technology in education.
- Promotion of research and innovation in higher education institutions.
- Creation of a National Research Foundation (NRF) to promote research in various disciplines.
- Establishment of a single regulator for higher education, the Higher Education Commission of India (HECI).
The NEP 2020 is a forward-looking and comprehensive policy framework that aims to transform the education system in India. The policy is expected to address the challenges facing the education sector and create a more inclusive, flexible, and innovative education system that can meet the needs of the 21st century.
How to Download BECC-111 Solved Assignment?
You can download it from the www.edukar.in, they have a big database for all the IGNOU solved assignments.
Is the BECC-111 Solved Assignment Free?
Yes this is absolutely free to download the solved assignment from www.edukar.in
What is the last submission date for BECC-111 Solved Assignment?
For June Examination: 31st April, For December Examination: 30th October
